Humanities Data with Death By Numbers Lesson Plan
Lesson plan created by Dan Howlett.
Death By Numbers is a data transcription project turning the London Bills of Mortality into structured data from primary sources. This lesson plan will use the Bills and the Death By Numbers project to introduce students at the high school or college level to thinking about historical sources as humanities data. Death By Numbers includes a database, data visualizations, and numerous blog posts that can provide additional context to the project and history.
Pre-class readings:
- Read: The London Bills of Mortality by Dan Howlett and Jessica Otis
- Read: Who Counts? Religion, Inclusion, and Exclusion in the Bills of Mortality by Jessica Otis
- Browse: Death Dictionary
- Browse: Look through the Data Visualizations
I. The Bills as Data (10-15 minutes)
Here is a 1666 General Bill, meaning a cumulative record of all the deaths recorded in the weekly Bills for the year. It provides various types of data captured in the Death By Numbers dataset. In class, have students look at the 1666 General Bill and see how many different types of data could be extracted from this source. Spend 10 minutes as a class looking at the Bill and considering what categories of data are included.
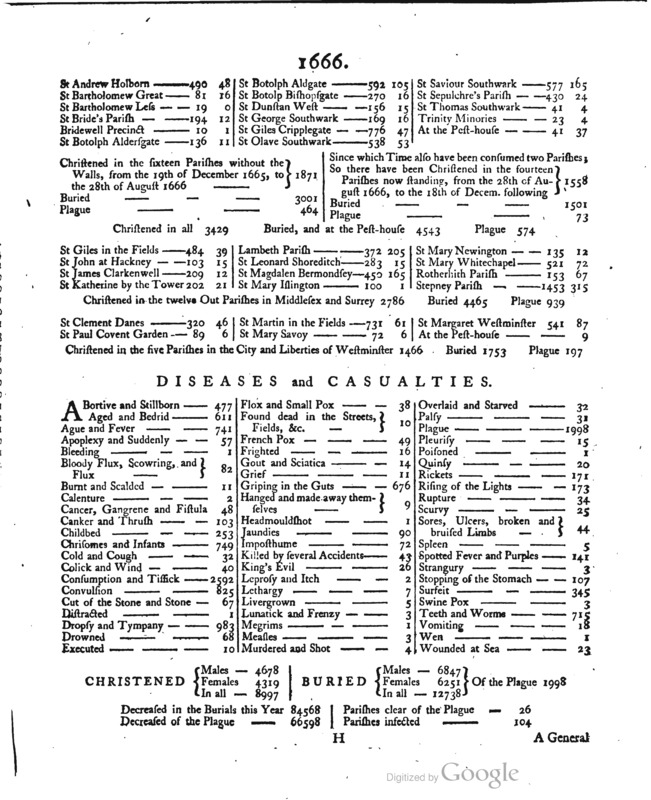
Figure 1. Verso of the 1666 General Bill.
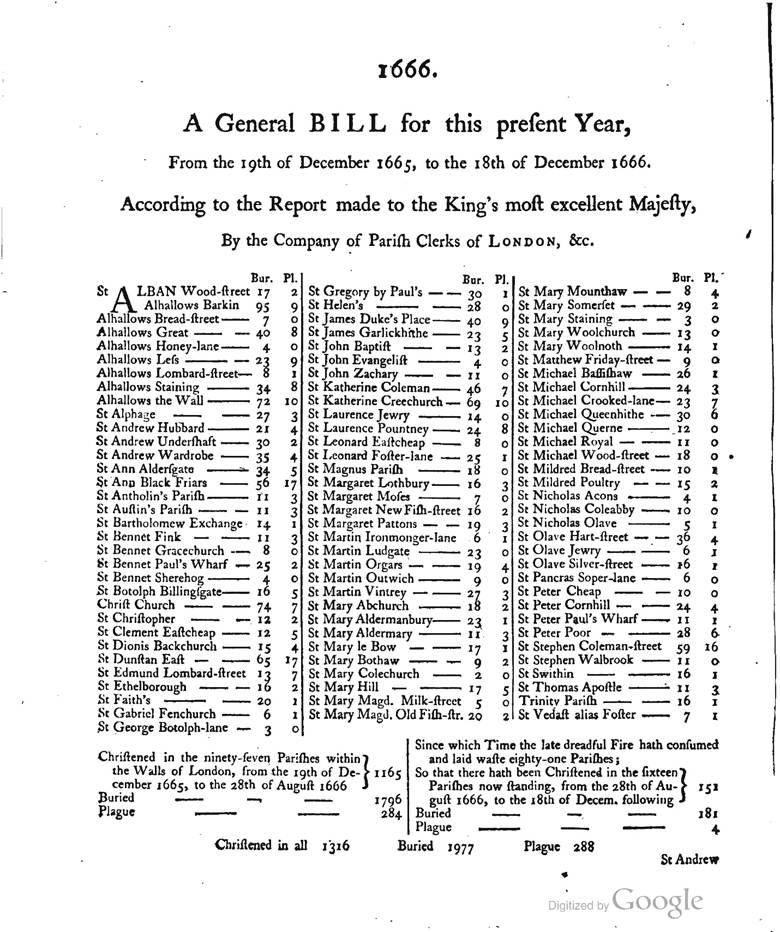
Figure 2. Recto of the 1666 General Bill.
The Death By Numbers project transcribed considered two main types of data: geographic and cause of death. Each weekly Bill of Mortality broke down the number of Burials and Plague deaths by Parish, allowing for a geographic analysis of plague deaths by tracking the spread of plague across the city each week. The parish lists are also separated into different areas of the city which allows for urban vs rural comparison. The weekly Burial data obscures the cause of death by location, but it also allows for analysis of geographic change. The causes of death data under Diseases and Casualties shows the cumulative totals of each cause of death for the year 1666 as reported in the weekly bills of mortality. Here, some causes are combined such as “Chrisoms and Infants” and “Gout and Sciatica.” In the weekly Bills, these causes are rarely combined so the transcriptions can uncover the totals without these mixed categories of data.
Other categories of data students might pull out of this bill include the dates, Christening totals, change in burials and plague deaths from the previous year, and parishes clear of the Plague or infected.
II. Messy Data (15-20 minutes)
Data can be messy, and the weekly Bills present wide ranges of diseases and casualties summarized in the Bills. For example, the 1669 General Bill mentions “Killed by several Accidents” and “Murdered and Shot.” The Death By Numbers database preserved messy data in several categories with descriptive text that elaborated on weekly reports. For example, in the 28th week of 1701, a person in St. Margaret in Westminster was killed “by a Cart.” Creating a table that allows for every possible variation would be near impossible, and likely not useful since the time to plan out a spreadsheet that allows tracking for each unique variable would take an enormous amount of time with little reward. Death By Numbers uses the categories Killed and Other as umbrella categories to collect the unusual and messy data. These are not perfect categories, and the project team sorted deaths as best as possible but likely with imperfection too.
Have students play with the database and filter for categories like Killed and Other to see how data is classified. For the project’s purposes, deaths as a consequence of human agency were listed as Killed, most were classified with their causes if available as listed in the Death Dictionary, and all other deaths were categorized as Other, including accidents, unclear descriptions, and oddities. Ask students to discuss these categories and debate whether they would maintain these categories or rewrite them.
Here is a list of some causes you give students and ask them to think about data categories and how Killed vs Other distinctions shape the data transcription process.
- Killed by the Wheel of a Wagon at St. Dunstan at Stepney
- Killed accidentally by a Cart at St. Clement Danes
- Killed by the fall of a House
- Sore Leg
- Broken Leg
- Found dead at St. Sepulchers
- Drowned in the river Thames
- Blown up by the Late Fire
- Killed by the Fall out of a Window at St. James Clerkenwell
- Poisoned
- Killed with a Sword at St. Giles in the Fields
Each of these causes of death allow for speculation about the human agency involved: was the poison an act of murder or a cooking accident? Did someone use the sword as a weapon at St. Giles or did the owner fall onto it? Is a sore leg a reference to a disease? Is a fall out a window a suicide? The Death By Numbers team made its own decisions about classifying deaths, but other researchers may catalog the data differently. Ask your students what changes if you reorganize the data with different meanings ascribed to causes of death.
III. Missing Data (15-20 minutes)
The Bills of Mortality include a lot of data, but a lot of data is absent from the bills. In some cases, the absence refers to a “zero” meaning there is no data entry to include. In other cases it might mean data is unreported. For Death By Numbers’ guidelines, parishes that did not report deaths in a weekly Bill suggested that zero deaths occurred, but a cause of death missing from the bill was treated like unreported data. For example, if a week does not list Gout as a cause of death, does it mean no Gout deaths occurred or does it mean the diagnosis of Gout was not attributed to a death? Here are some examples for students to discuss where “zero” and “missing” might apply and consider the implications behind that decision.
- St. Ann in Middlesex parish does not list a number of reported burials
- The weekly Bill of Mortality does not include Tissick as a cause of death but does include other tuberculosis causes like Evil and Consumption as described in the Death Dictionary.
- St. Botolph Aldersgate reports weekly burials for over 10 weeks and suddenly on week 11, no burials are reported.
- The printer of the bills adds a note that St. Martin Vintry’s parish did not send any statistics for the week
- A tear in the Bill of Mortality means a fragment of the page is missing and you cannot see what causes of death were listed
Now ask students to consider the pre-class reading “Who Counts?” and think about missing data as forms of deliberate and accidental exclusion. The Death By Numbers project team made specific decisions when transcribing to account for missing and unknown data, but what about the historical actors who produced the data? What biases might they have encoded into the Bills of mortality?
IV. Other Possible Questions for in-class discussion:
- Notice how according to the Death Dictionary, causes like Consumption, King’s Evil, and Tissick all include tuberculosis in the definition. Causes of death in the Bills versus how contemporary medicine might define a disease are not synonymous. How should we think about historical data and historical terminology?
- What categories of data would you include? Should the project have categorized Natural Disaster, Accident, and Murder deaths rather than Killed and Other? How would changing these overarching categories affect the data?
- How can or should historians and data scientists use data that is known to be flawed?
- Think about the micro vs macro views provided in the Bills of Mortality. You can look at the description of a single death, a week of deaths, a year, or the cumulative totals of deaths. How does a “big data” analysis change your understanding of life in early modern London?
Suggested citation
Please use the following as a suggested citation:
Dan Howlett, “Humanities Data with Death By Numbers Lesson Plan,” Death by Numbers, Roy Rosenzweig Center for History and New Media, George Mason University (2025): https://deathbynumbers.org/teaching/humanities-data/.