Kild by the Blast of Gunpowder
by
Jessica Otis
Megan Klingeman
2025-12-03Content Warning: This post contains subject matter that some may find sensitive or disturbing, be advised. If uncomfortable with this topic, you may support Death By Numbers in other posts.
This post contains descriptions of bodies after a gunpowder explosion and fire.
In January of 1649/50, the city of London was still reeling from almost a decade of civil war that had led to the beheading of King Charles I less than a year earlier. Tensions between the Royalist supporters of the new King Charles II and supporters of the Commonwealth government were still high and war still raged in Ireland and Scotland. The old king was dead, but the War of the Three Kingdoms was not yet over.
We are in the process of checking the arithmetic of the Bills of Mortality, both its internal consistency as well as the accuracy of our work, and are making our Jupyter notebooks of our analysis public. The notebooks take into account transcription errors, printing mistakes, illegible data, or duplicate data to capture a comprehensive analysis of the data.
Checking for duplicate transcriptions: This notebook analyzes duplicate transcriptions in the Bills of Mortality dataset to estimate the overall accuracy of our transcribed data. It does not differentiate between data that was mistranscribed and data that was printed differently in two separate copies of the same bill of mortality; both are considered “inaccurate” data.
Alongside quantitatively documenting plague outbreaks in Early Modern London, the Bills of Mortality also provide textual descriptions of causes of death. The Death by Numbers project is transcribing and making available to the public not only the plague numbers but also dozens of recorded causes of death found in the verso of the bills, which include accidents, killings, suicides, and drownings. This will eventually create a considerable –although not massive– corpus of textual data suitable for the application of several text analysis techniques, as a way to automate the extraction of information. For this blog post, I am using three datasets on causes of death compiled by the Death by Numbers transcription team. The first dataset covers the period from 1636 to 1649, the second from 1649 to 1659, and the third from 1659 to 1677. It’s important to note that while these datasets cover most years within these ranges, there are some gaps in the data.
Following 1636’s outbreak, the plague cast a shadow over London’s life for almost ten years. Data collected from the Bills of Mortality by the Death By Numbers Project suggests that most summers witnessed a plague flare-up between 1638 and 1647. Though in the late 1630s these summer spikes were mild, the occurrence of the plague increased in intensity in the early 1640s up to 1647.1 Indeed, each summer during the 1640s, weekly deaths in London consistently reached into the hundreds, peaking at 250 in the years 1646 and 1647.2 Moreover, during the consecutive years of 1641-1642 and 1646-1647, the yearly outbreaks adopted a bi-annual cyclical pattern. Londoners endured the threat of the plague year-round, with fewer deaths in winter and a larger number of casualties during late summer. By the 1650s, however, the plague had nearly vanished, only to return forcefully during the notorious Great Plague of 1665-1666.
On Wednesday August 30, 1665, the diarist Samuel Pepys ran into his parish clerk and asked how the plague was progressing within their parish. To his dismay, the clerk “told me it encreases much, and much in our parish.” Worst of all, the clerk admitted that the plague was so bad that he had falsified his weekly reports of parish plague deaths: “for, says he, there died nine this week, though I have returned but six.” Whether or not Pepys castigated the parish clerk in person, he recorded his condemnation of such “a very ill practice” in his diary. The numbers within the bills of mortality were a vital public health guide during plague outbreaks and it was imperative for them to be as accurate as possible.
Death on Two Legs: Analyzing the initial 20 weeks of the 1636 London plague outbreak using time-to-event analysis. During the seventeenth century, England experienced multiple plague outbreaks. Although milder than the 1603 and 1624 plague crisis, London’s outbreak of 1636 claimed the lives of roughly 10,400 individuals, approximately 7.5% of the population in London and its liberties.1 In this blog post, I delve into the first stages of the 1636 outbreak, by scrutinizing the propagation of the plague through London’s city subdivisions, with the aid of time-to-event analysis. The results suggest that, although all parish groups encountered at least one case of the plague in the initial two weeks of the outbreak, the propagation of the plague in the parishes within the walls of London came to a relative halt. In contrast, the outbreak’s trajectory became significantly steeper in the remaining parts of the city, namely the parishes without the walls, the parishes in Middlesex and Surrey, and the outer parishes of Westminster. The analysis aligns with existing literature that highlights a prevalent spatial pattern for plague outbreaks in the seventeenth century: specifically, a milder impact within the city walls and harsher consequences in London’s peripheral areas.2 This spatial pattern can be attributed to a combination of factors, including stricter public health strategies–quarantines and isolation–implemented by the city government in the late sixteenth century, as well as the sociodemographic characteristics of early modern London. Furthermore, the analysis unveils that the implementation of containment measures led to a spatially differentiated trajectory of the outbreak: early plague deaths within the walls of London didn’t amount to a propagation of the plague with the same speed as the parts of the city outside the walls.
The Bills of Mortality were weekly reports that recorded the number of deaths in London, beginning in 1603 and continuing consistently until 1819. These bills reported the number of burials and plague deaths in each London and surrounding parish. They also reported the different causes of death, male/female christenings, and male/female burials for the entire city. The causes of death included illnesses and ailments, as well as accidents and killings. Two causes of death—execution and murder—have the possibility of being cross-referenced with other early modern documents, particularly court records.
During the early modern period, the city of London produced weekly mortality reports called bills of mortality. These bills—printed from 1603 onward—detail the number of deaths per parish; plague deaths per parish; and deaths citywide by cause of death. However printed bills were actually summaries of manuscript bills produced for the monarch, which contain a parish-by-parish breakdown of every cause of death throughout the city of London for the preceding week. The monarchical bills enable us to study not just plague deaths by parish, but also every type of death that Londoners tracked in the bills of mortality.
During the early modern period, the city of London produced weekly mortality reports called bills of mortality. These bills—printed from 1603 onward—detail the number of deaths per parish; plague deaths per parish; and deaths citywide by cause of death. However printed bills were actually summaries of manuscript bills produced for the monarch, which contain a parish-by-parish breakdown of every cause of death throughout the city of London for the preceding week. The monarchical bills enable us to study not just plague deaths by parish, but also every type of death that Londoners tracked in the bills of mortality.
Samuel Pepys is primarily remembered for his decade-long diary, which recorded major events in 17th century English history including the Great Plague Outbreak (1665).1 Just before the height of the plague, on September 7, 1665, Pepys wrote in his diary, “[I] sent for the Weekely Bill, and find 8,252 dead in all, and of them 6,878 of the plague; which is a most dreadfull number, and shows reason to fear the plague hath got that hold that it will yet continue among us.” 2 While Pepys’ remark over the number of plague deaths was numerically incorrect (our records indicate the number of plague deaths was actually 6,978), Pepys was right to worry about the amount of death and the vice grip that plague held in London.3
Figure 1. A photograph of the bill of mortality for the week of November 14-21, 1665.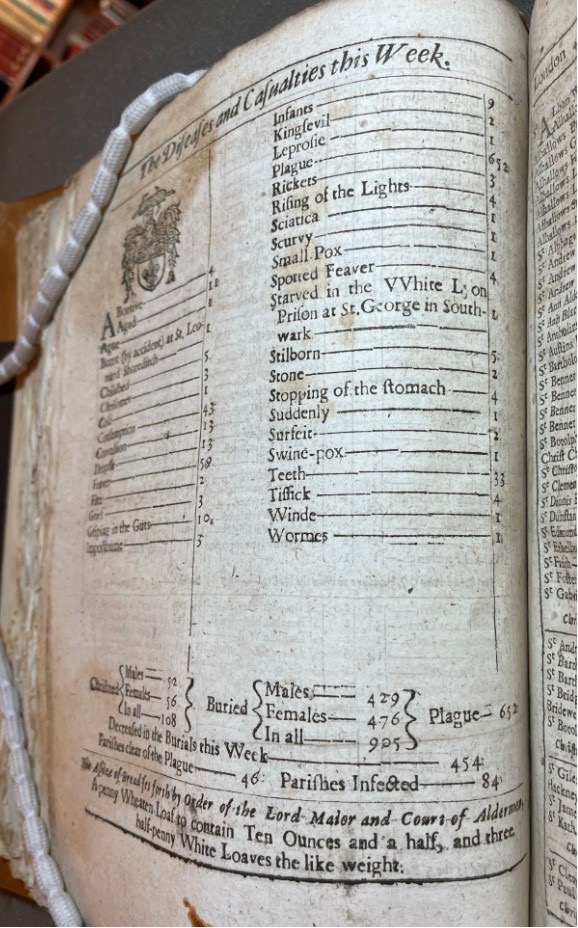
On the Bill of Mortality for the week of November 14-21st, 1665, plague deaths were finally decreasing from a horrific summer. The total number of plague deaths was still a staggering six hundred and fifty-two, but that did not stop parish officials from recording all the other ways that Londoners were dying. One death stood out as an intriguing mystery: starved in White Lyon prison at St George in Southwark. Who was this person? Can we figure it out based on online historical sources? Researching the bills of mortality not only gives the stark numbers of death but also opens historical questions about specific outliers in the numbers, like the one starvation death in prison noted amongst hundreds of deaths due to plague. What can the numbers from the Bills of Mortality tell us, and what can they not?
At about 3am on Sunday, September 2, 1666, the diarist Samuel Pepys’ maid Jane awakened him to let him know about a fire that had started within the ancient city walls of London. He looked out the window, thought it was too far away to worry about, and went back to sleep. When he got up the next morning, Jane relayed the news that over 300 houses had already burned, so he went to the Tower of London and climbed to a high spot where he could see the extent of the threat: “an infinite great fire”1 which would rage for four days before being reduced to embers that ominously smoldered in cellars for several more weeks. Along the way it would take out over 13,200 houses, 44 of the 51 livery company halls, and 84 parish churches, along with the city’s spiritual heart of St. Paul’s Cathedral.2 Only valiant fire-fighting efforts kept the flames from reaching the gunpowder stores at the Tower of London, which would have been a disaster of unprecedented scope.
In late November of 1703, a “great storm” or hurricane struck the British Isles. Bad weather began a few days before the heart of the storm made landfall on November 26th, spawning tornadoes, ripping off roofs and chimneys, and destroying entire fleets. One of the most famous tragedies of the storm happened on the Goodwin Sands, a deadly sandbank off the coast of Kent. At least 53 ships were wrecked on the sandbank and over 2,000 men died just six miles from safety.
The London Bills of Mortality were originally and primarily focused on deaths from plague, however they very quickly expanded to include other causes of death as well. From accidents and drownings to measles and smallpox, the printed bills included citywide summary statistics—rather than parish-by-parish breakdowns—for each week.
While we can therefore learn a fair amount about causes of death throughout the city, very little information can be gleaned from the sixteenth- and seventeenth-century bills about the age at which people died. True, chrisoms indicated a baby less than a month old, while infants indicated a slightly older baby, but what about deaths from teeth or choking? Was a person dying in childbirth a preteen or a woman in her forties? Diseases like consumption (tuberculosis) spared no one, young or old, and probably killed two Tudor kings: Edward VI, aged fifteen, and his grandfather Henry VII, aged fifty-two. Even deaths flagged as “Aged” don’t give a clear sense of how old, exactly, one had to be to die of age in the early modern period.