Jessica Otis is the project director of the Death by Numbers project and an assistant professor in the Department of History and Art History at George Mason University.
Content Warning: This post contains subject matter that some may find sensitive or disturbing, be advised. If uncomfortable with this topic, you may support Death By Numbers in other posts.
This post contains descriptions of bodies after a gunpowder explosion and fire.
In January of 1649/50, the city of London was still reeling from almost
a decade of civil war that had led to the beheading of King Charles I
less than a year earlier. Tensions between the Royalist supporters of
the new King Charles II and supporters of the Commonwealth government
were still high and war still raged in Ireland and Scotland. The old
king was dead, but the War of the Three Kingdoms was not yet over.
We are in the process of checking the arithmetic of the Bills of Mortality, both its internal consistency as well as the accuracy of our work, and are making our Jupyter notebooks of our analysis public. The notebooks take into account transcription errors, printing mistakes, illegible data, or duplicate data to capture a comprehensive analysis of the data.
Checking for duplicate transcriptions: This notebook analyzes duplicate transcriptions in the Bills of Mortality dataset to estimate the overall accuracy of our transcribed data. It does not differentiate between data that was mistranscribed and data that was printed differently in two separate copies of the same bill of mortality; both are considered “inaccurate” data.
On Wednesday August 30, 1665, the diarist Samuel Pepys ran into his parish clerk and asked how the plague was progressing within their parish. To his dismay, the clerk “told me it encreases much, and much in our parish.” Worst of all, the clerk admitted that the plague was so bad that he had falsified his weekly reports of parish plague deaths: “for, says he, there died nine this week, though I have returned but six.” Whether or not Pepys castigated the parish clerk in person, he recorded his condemnation of such “a very ill practice” in his diary. The numbers within the bills of mortality were a vital public health guide during plague outbreaks and it was imperative for them to be as accurate as possible.
During the early modern period, the city of London produced weekly mortality reports called bills of mortality. These bills—printed from 1603 onward—detail the number of deaths per parish; plague deaths per parish; and deaths citywide by cause of death. However printed bills were actually summaries of manuscript bills produced for the monarch, which contain a parish-by-parish breakdown of every cause of death throughout the city of London for the preceding week. The monarchical bills enable us to study not just plague deaths by parish, but also every type of death that Londoners tracked in the bills of mortality.
During the early modern period, the city of London produced weekly mortality reports called bills of mortality. These bills—printed from 1603 onward—detail the number of deaths per parish; plague deaths per parish; and deaths citywide by cause of death. However printed bills were actually summaries of manuscript bills produced for the monarch, which contain a parish-by-parish breakdown of every cause of death throughout the city of London for the preceding week. The monarchical bills enable us to study not just plague deaths by parish, but also every type of death that Londoners tracked in the bills of mortality.
At about 3am on Sunday, September 2, 1666, the diarist Samuel Pepys’ maid Jane awakened him to let him know about a fire that had started within the ancient city walls of London. He looked out the window, thought it was too far away to worry about, and went back to sleep. When he got up the next morning, Jane relayed the news that over 300 houses had already burned, so he went to the Tower of London and climbed to a high spot where he could see the extent of the threat: “an infinite great fire”1 which would rage for four days before being reduced to embers that ominously smoldered in cellars for several more weeks. Along the way it would take out over 13,200 houses, 44 of the 51 livery company halls, and 84 parish churches, along with the city’s spiritual heart of St. Paul’s Cathedral.2 Only valiant fire-fighting efforts kept the flames from reaching the gunpowder stores at the Tower of London, which would have been a disaster of unprecedented scope.
PI Jessica Otis will be presenting on Death by Numbers at the annual meeting of the Renaissance Society of America this week. For anyone attending the meeting, the presentation will be Friday, March 10th, from 4:30-6PM in the Caribe Hilton Gran Salón Los Rosales A - Gran Salón Los Rosales (Garage). Free notebooks and stickers with the project logo will be available for anyone who wants one.
Welcome to the relaunch of our blog and the formal beta launch of the
Death by Numbers database.
While our blog has been quiet, we’ve been busy behind the scenes getting
our code squared away and finishing transcribing some of the early
datasets so that the project was in a good place for a public debut.
We’re still hard at work adding data to the database and building our
first visualizations, so don’t be surprised at how large some of the
gaps are in the dataset. But we wanted to go public and give our
audience a chance to provide feedback on what we’ve created so far.
In late November of 1703, a “great storm” or hurricane struck the British Isles. Bad weather began a few days before the heart of the storm made landfall on November 26th, spawning tornadoes, ripping off roofs and chimneys, and destroying entire fleets. One of the most famous tragedies of the storm happened on the Goodwin Sands, a deadly sandbank off the coast of Kent. At least 53 ships were wrecked on the sandbank and over 2,000 men died just six miles from safety.
The London Bills of Mortality were originally and primarily focused on deaths from plague, however they very quickly expanded to include other causes of death as well. From accidents and drownings to measles and smallpox, the printed bills included citywide summary statistics—rather than parish-by-parish breakdowns—for each week.
While we can therefore learn a fair amount about causes of death throughout the city, very little information can be gleaned from the sixteenth- and seventeenth-century bills about the age at which people died. True, chrisoms indicated a baby less than a month old, while infants indicated a slightly older baby, but what about deaths from teeth or choking? Was a person dying in childbirth a preteen or a woman in her forties? Diseases like consumption (tuberculosis) spared no one, young or old, and probably killed two Tudor kings: Edward VI, aged fifteen, and his grandfather Henry VII, aged fifty-two. Even deaths flagged as “Aged” don’t give a clear sense of how old, exactly, one had to be to die of age in the early modern period.
The Bill of Mortality from Christmas week in 1664 reports that three people died in the parish of St Foster. But fifty years later, there were happily no Christmas deaths in the parish of St Vedast—or rather, the parish of “St Vedast alias Foster.” Because the parish of St Vedast is the parish of St Foster. Welcome to the complex world of early modern parish names.
Given that our sources were published over the course of centuries, it’s hardly surprising that the names of some of the parishes in the bills changed over time. It does, however, present a bit of a challenge for our project since transcribers must be able to match the names in the bills to the names on the transcription form. And even if we were to change the names on the transcription form to accommodate changing parish names, analyzing bills of mortality over time still requires us to know whether a parish listed on a bill in 1582 is the same as a parish listed in a bill in 1752. Our solution has been to create a master list of the parish names, which includes the parish names we use on the transcription forms along with variant names that transcribers might encounter over time. These variant names are then included both in the transcription form and the detailed guidelines for our transcribers.
One of the more helpful digital databases for the study of early modern history is Early English Books Online (EEBO), which contains images of most of the surviving books printed in England between 1473 and 1700. It builds upon the cataloging work of 19th-century bibliographers and began its life as a collection of microfilm in the late 1930s and 1940s before being digitized at the turn of the twenty-first century.1 Because its focus is on books rather than broadsides or bills, EEBO only contains a small fraction of the early modern Bills of Mortality but a keyword search for the bills still turns up almost 500 results. Perhaps unsurprisingly, these are largely publications that mention the bills rather than the bills themselves. However, it is interesting that these publications are not discussing the bills as a source of quantitative data on mortality. Instead, they are using the bills as a synonym for a place: the city of London and its suburbs.
The main organizational unit behind the London Bills of Mortality is the parish: a religious administrative unit usually consisting of one or more churches, their associated staff, and all Christians living within the geographical bounds of the parish. The parish clergy christened, married, and buried their parishioners and—starting in the sixteenth century—the parish clerk kept a register of those events. The burial numbers would eventually form the basis of the bills, with christenings added later.
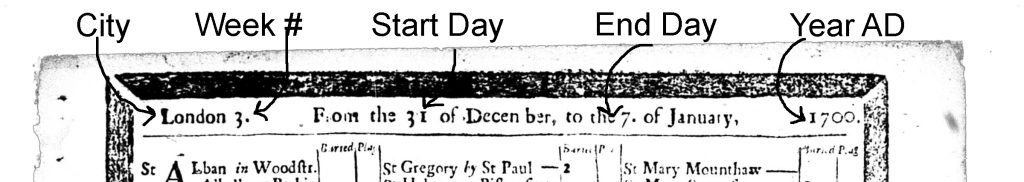
One of the first things a Bill of Mortality tells the reader is the date. The bill (partially) pictured below covers mortality data for the city of London, in the 3rd week of the current bills’ year, which ran from the 31st of December to the 7th of January in the year 1700 AD (from the Latin, Anno Domini, which was often translated into English as the Year of the Lord).
Figure 1. Annotated bill of mortality with arrows pointing to the city name (London), bill number (3), start and end days (‘From the 31st of December to the 7th of January’) and AD year (1700).
Plague epidemics were a recurring threat in late medieval and early modern Europe. While plague could and did strike anywhere, the most well-documented epidemics were often in cities. Responses varied across time and space, as city leaders and other political authorities attempted to avoid contagion, contain the sick, and understand the scope of the threat plague currently posed to their lives and their livelihoods. These responses included the creation of lists: lists of people sick with plague, lists of cities infected with plague, and–starting in the sixteenth century–lists of the number of people who had died of plague.
The Death by Numbers team is excited to announce that we have won a grant from the NSF, officially titled Digitization and Analysis of the Bills of Mortality Data Set. This grant runs from 2021 to 2024 and the grant abstract is reproduced below:
One of the most dreaded diseases in early modern England was plague. The city of London alone lost an estimated 225,000 people to plague in the century between 1563 and 1665. As an extension of government attempts to track plague deaths during outbreaks, London officials started publicly distributing a weekly series of mortality statistics called the Bills of Mortality at the turn of the seventeenth century. London’s population rapidly embraced the bills as a tool for evaluating their risk of imminent death, which led to the bills’ continuous weekly publication starting in 1603. These public bills also contained all-inclusive death counts and numbers for dozens of other causes of death, ensuring their ongoing publication and widespread distribution for over a century after the final outbreak of plague in England. This project uses the Bills of Mortality to investigate how lived experiences of plague outbreaks intersected with an emerging quantitative mentality among the people of early modern England. It examines how ordinary people aggregated, transformed, and interpreted death counts in order to draw conclusions about changes in the early modern use of and trust in numbers over time. In doing so, the project investigates contemporary perceptions of numbers and historicizes a quantitative method of knowledge generation that has become central to twenty-first-century understandings of the world.