| September 26, 2024
Death by Words: Textual Geography of Suicides, Drownings and Killings in the Bills of Mortality
Alongside quantitatively documenting plague outbreaks in Early Modern London, the Bills of Mortality also provide textual descriptions of causes of death. The Death by Numbers project is transcribing and making available to the public not only the plague numbers but also dozens of recorded causes of death found in the verso of the bills, which include accidents, killings, suicides, and drownings. This will eventually create a considerable –although not massive– corpus of textual data suitable for the application of several text analysis techniques, as a way to automate the extraction of information. For this blog post, I am using three datasets on causes of death compiled by the Death by Numbers transcription team. The first dataset covers the period from 1636 to 1649, the second from 1649 to 1659, and the third from 1659 to 1677. It’s important to note that while these datasets cover most years within these ranges, there are some gaps in the data.
For the purpose of this blog entry, I will not focus on text as text, but only on text as a container of relevant information for the exploration of drownings as a historical phenomenon. I will use basic text analysis tools to retrieve the locations from descriptions of drownings, killings, and suicides, as opposed to manually counting the locations. With this data, I will create maps to spatially represent the counts. I won’t analyze text to discover hidden patterns or underlying meanings of a corpus of texts — although I am planning to try that in a future post. Eventually, the techniques explored in this blog post will be a good fit to extract other data recorded as unstructured text in the London Bills of Mortality
Methodology and Workflow
The transcription process in Death by Numbers using DataScribe generates a dataset where each record of a weekly bill occupies a row, and the causes of death are represented as columns. Descriptions of drownings, killings, suicides, people found dead, and accidents are recorded as unstructured text, typically including a count, the location, and occasionally a brief account of the incident. For instance, drowning’s descriptive text highlights the location (at Christ Church in Surry; at the London Bridge; at the River Lee), a brief characterization of circumstances (accidentally; by misfortune; in a ditch; in a tub of soap suds), and occasionally some data about the drowned person (an unknown man; two brothers; a boy). To both capture and provide structure to the text, our transcription team fills out two fields in the DataScribe transcription form: one for the count and one for the text.
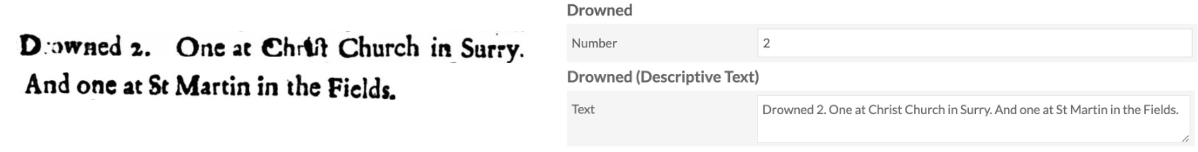
Fig 1. View of the transcription form fields designed to capture the text about drowning deaths.
To summarize the methodology, I begin in Visual Studio Code by extracting text from descriptive columns, such as the ‘Drowned (Descriptive Text)’ column shown in Figure 1, and appending it to a list. I then handle missing values by replacing any NaN elements with empty strings. Additional cleanup involved replacing punctuation with spaces and removing unwanted words. At this point, one critical step is correcting the many misspelled variants of parish names by matching them with the correct ones (the ones we use in our Omeka install). The transcription team captures the text mostly as it appears, preserving the wide range of original spellings from the Bills in the transcribed data. Correcting the typos involves constructing a dictionary of key-value pairs to fix all misspellings in the original text. Later, I repeated this process on the final data frame with a slight variation: I created a new column by remapping all variants with the correct parish names and grouped the data by these corrections to remove duplicates. Although time-consuming, this process proved to be somewhat rewarding and brought a certain sense of accomplishment.
Observing the text reveals that locations typically follow the preposition “at.” With a few lines of code we can extract the two words after “at” (2-grams) that correspond to a parish name. By using a counter object, I created a dictionary object that stores the parish and a number of how many times it is mentioned within each roughly 10 year data set. It would also be possible to obtain a week-to-week, month-to-month or year-to-year extraction, but for that it would be necessary to retain the week of each text into a dataframe (I am also planning to do that in a future iteration of this research). Finally, I converted the counter into a data frame and joined it with the geometries of each parish, allowing me to map the counts. What follows is a descriptive analysis of the most mentioned places and the totals.
Mapping Killings, Suicides and Drownings
As mentioned before, The Death by Numbers Project builds data sets with textual descriptions of killings. However, it is not exactly a copy and paste process but an interpretive procedure. We built an aggregate category in which we include any death involving human agency, such as murder, shooting, stabbing, or being run over by a cart, etc. These deaths show up in the Bills in different parts of the causes listed. The total killings for the three data sets are 126, 114, 228, the last number being larger due to a lengthier set of weeks. The parishes with the highest number of human-caused deaths across the three datasets were St. Giles in the Fields, St. Mary Whitechapel, St. Martin in the Fields, St. Giles Cripplegate, St. Sepulchre’s Parish, and to the south of the Thames River, St. Saviour’s Southwark. Among the 97 parishes within the Walls of London, those located along the Thames had the highest number of killings, with Allhallows Great, Allhallows Less, St. Mary Somerset, St. Magnus Parish, and St. Dunstan East being the most frequently mentioned locations.
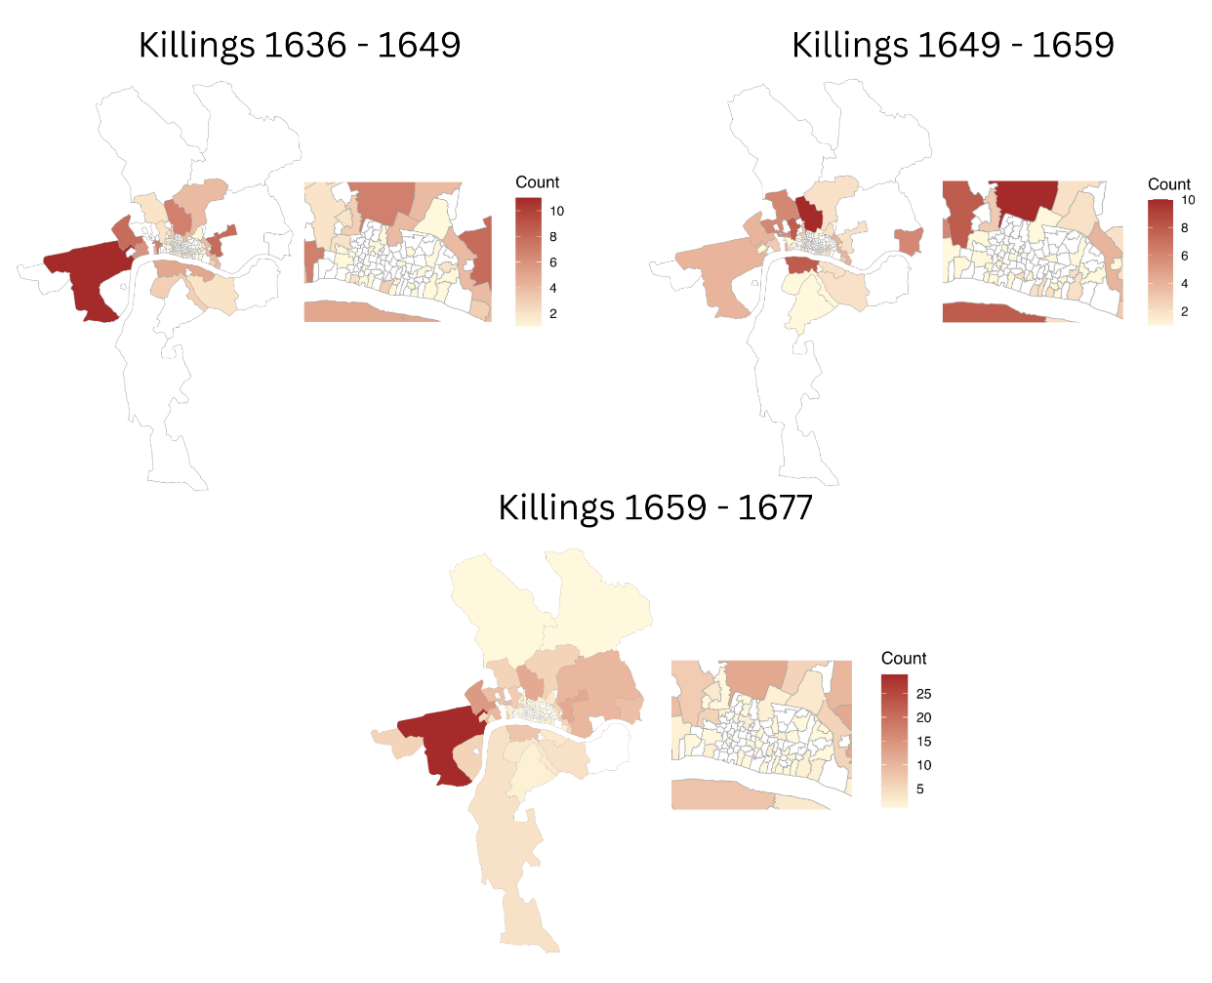
Fig 2. Spatial Representation of Killings in each of the three data sets analyzed.
The suicide field is constructed by transcribing any suicides that are recognizable by descriptions of a human being actively taking his/her life like “hanged himself”, “poysoned himself” and “stabbed himself”. This category also includes deaths described as “distraction” or “being distracted,” a term rooted in the uncertainty surrounding suicide motives and the widespread belief among authorities that it represented a rejection of religion (for more details see this post in our blog). The number of suicide deaths extracted from the dataset totaled 56, 75, and 124, respectively. The parishes with the highest number of suicide incidents include St. James Clerkenwell, St. Sepulchre’s Parish, St. Andrew Holborn, St. Olave Southwark, St. Mary Whitechapel, St. Giles Cripplegate, and St. Giles in the Fields. Notably, St. Botolph Bishopsgate had the most suicides across all three datasets, with a total of eleven incidents. This is not simply a coincidence, as St. Botolph was home to Bethlehem Hospital (commonly known as Bedlam), which housed a large number of patients diagnosed with various forms of lunacy or mental disorders.
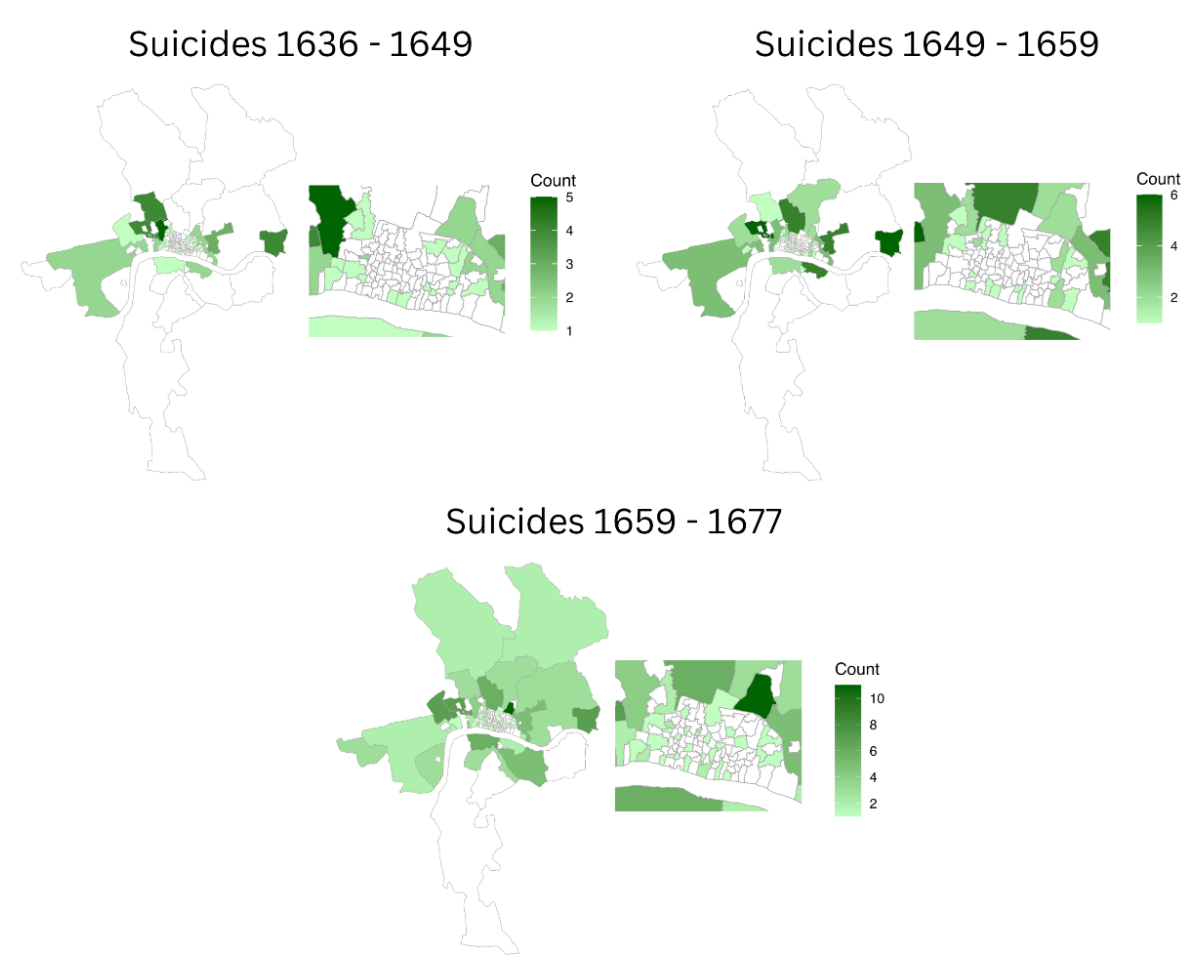
Fig 3. Spatial Representation of Suicides in each of the three data sets analyzed.
Drowning deaths are both more concentrated and more frequent than suicides and killings. The parishes with the highest number of drowning incidents include St. Saviour’s Southwark, St. Olave’s Southwark, and Stepney Parish. However, the majority of drowning fatalities are centered in St. Katherine’s Tower, where the number of immersion deaths totals 223, 213, and 368 across the three datasets, respectively. Most of the deaths at St. Katharine’s Tower were likely related to dock work and tied to transport and shipping activities, as the wharves at St. Katharine’s, known as ‘Sufferance Wharves,’ received hundreds of ships that unloaded their goods and cargo at the quays.1
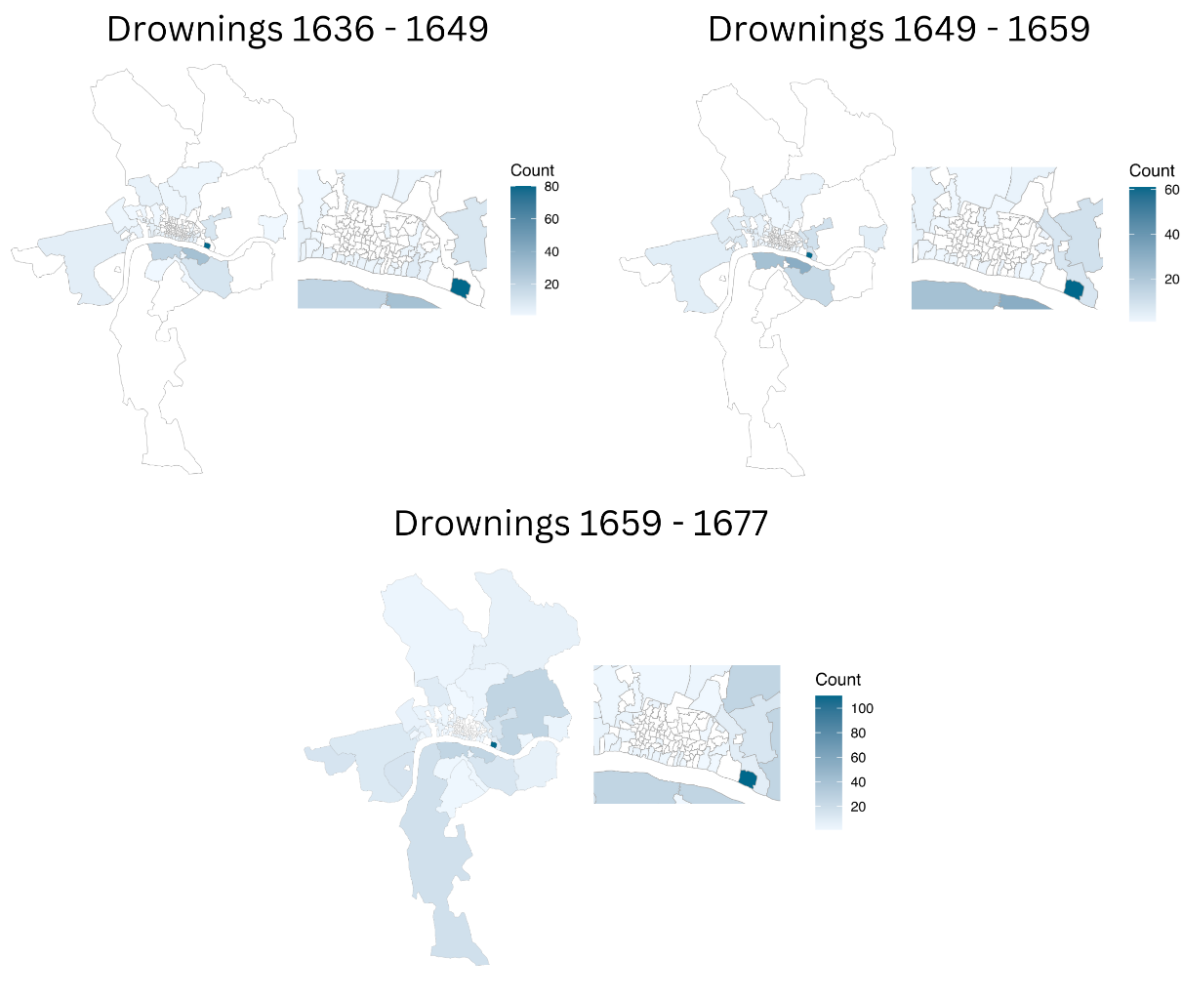
Fig 4. Spatial Representation of Drownings in each of the three data sets analyzed.
Conclusion
The Bills of Mortality not only provide quantitative records of plague outbreaks but also contain valuable textual descriptions of various causes of death. The Death by Numbers project is making these records accessible, including accidents, killings, suicides, and drownings, creating a dataset ripe for future text analysis. For this blog post, I focused on using basic text analysis tools to extract locations from these descriptions, specifically in relation to drownings, killings, and suicides, and visualized the data spatially. However, a flaw in the analysis is that this post does not yet incorporate demographic data to normalize these raw numbers obtained with text analysis techniques. Additionally, it would be valuable to corroborate the text extraction process with a manual review of the data to ensure accuracy, though the whole idea in this post is to skip the time-consuming and error-prone task of counting the mentioned one by one. While this post centers on location extraction, there remains great potential for deeper analysis of the textual descriptions that were left outside in this analysis: found dead, starved, executed, and also accidental deaths, which I intend to explore in future posts. The techniques applied here will continue to prove useful in extracting structured information from the rich, unstructured text found in the London Bills of Mortality.
For an introductory overview of how St. Katharine’s Tower became home to the new docks in the early 1800s, see https://www.thehistoryoflondon.co.uk/the-new-london-docks-of-the-early-19th-century/. ↩︎