| August 28, 2024
A Deadly Decade: Yearly Plague Spikes in Early Modern London between 1638-1647
Following 1636’s outbreak, the plague cast a shadow over London’s life for almost ten years. Data collected from the Bills of Mortality by the Death By Numbers Project suggests that most summers witnessed a plague flare-up between 1638 and 1647. Though in the late 1630s these summer spikes were mild, the occurrence of the plague increased in intensity in the early 1640s up to 1647.1 Indeed, each summer during the 1640s, weekly deaths in London consistently reached into the hundreds, peaking at 250 in the years 1646 and 1647.2 Moreover, during the consecutive years of 1641-1642 and 1646-1647, the yearly outbreaks adopted a bi-annual cyclical pattern. Londoners endured the threat of the plague year-round, with fewer deaths in winter and a larger number of casualties during late summer. By the 1650s, however, the plague had nearly vanished, only to return forcefully during the notorious Great Plague of 1665-1666.
This blog post explores seven of the nine years between 1638 and 1647 by applying time-to-event analysis, in the same way I did in the previous 1636’s outbreak post.3 The analysis shows that the spatial pattern from the 1636 outbreak continued, where, despite plague deaths occurring in all parish groups, the spread within London’s walled parishes was notably slower. In contrast, the plague death spikes intensified notably in the city’s other areas, including the parishes outside the walls, those in Middlesex and Surrey, and the outer parishes of Westminster. Even when plague deaths occurred year-round, such as in years 1642, 1644, 1646 and 1647, the parishes within the walls did not experience severe plague flare-ups, though their situation deteriorated as the decade progressed.
A more detailed analysis reveals that during 1638 and 1639, the presence of the plague was significantly milder compared to subsequent years, a trend also evident in the survival probability, which only began to drop considerably after week 30. However, in the 1640s the impact of the plague intensified, evidenced not only by an increase in total deaths but also by a steeper decline in the survival probability curve. It can be argued that the same mix of factors that mitigated the severity of the 1636’s outbreak –quarantines and isolation in pesthouses, along with the sociodemographic traits of early modern London– remained in place throughout 1638-1647, containing the yearly warm season plague sprouts. Nevertheless, these factors alone were insufficient to eradicate the threat of the plague until the 1650s.
It is interesting to note that the growing threat posed by the plague in the 1640s coincided with the clash between Royalists and Parliamentarians during the English Civil War. Though no direct correlation can be made without thorough historical research, the political instability during this period may have had detrimental effects on the city authorities’ efforts to contain the plague, potentially contributing to its intensification between 1642 and 1647
The blog post is structured into two main sections. First, I explore the late 1630s, by examining the outcomes of the time-to-event analysis and comparing the survival curves of four parish groups. Both total deaths and survival distributions have been represented spatially by plotting the parishes. The second section repeats the same analysis for the years 1642, 1644, 1646, and 1647.
- Multi-year time-to-event-analysis: 1638-1647
As detailed in a prior blog post, time-to-event analysis examines the length of time until a specified event of interest occurs. The event of interest is the occurrence of at least one plague death in each of the 131 London’s parishes during the total number of weeks available for each year. With the aid of the Kaplan-Meier estimator we get the survival function of each year’s data, which measures the likelihood of a parish not reporting a plague death within the specified set of weeks. Finally, by using the Log-Rank test it is possible to contrast the survival distributions of the groups of parishes that formed London’s urban structure, in order to ascertain if the rate at which the plague spread through these four groups differs significantly. As I did in the post about the 1636 outbreak, London’s parishes are categorized into four groups following the partitions in the bills themselves: group 1 (97 parishes are located within the walls of London), group 2 (16 parishes are situated outside the walls), group 3 (9 outlying parishes are in Middlesex and Surrey), and group 4 (7 parishes are found in the City of Westminster and its Liberties).
Based on the analysis of the survival functions and survival curves, the results allow us to divide the seven years into two periods: initially, the years 1638 and 1639, and subsequently, the years 1642, 1644, 1646, and 1647. The year 1641 has been left out from the analysis due to the incomplete nature of the data, since we only have 19 weeks out of the 52 possible, and it is only included in the bi-annual analysis. The differences and similarities among these two sets of years suggest that both the conditions affecting survival and the public responses to the outbreak yielded similar outcomes.
- The plague in the years 1638 and 1639
In the years 1638 and 1639, the plague summer flare-ups were mild, with no substantial spikes in weekly deaths. In terms of casualties, the total annual deaths amounted to 348 and 316 in 1638 and 1639 respectively. The most deadly weeks were weeks 38 and 39 in 1638, and 40 and 43 in 1639. Figure 1 displays a bar plot illustrating the yearly trends of plague deaths in 1638 and 1639, divided by weeks. The x-axis represents the weekly counts for each year in chronological order, while the y-axis indicates the total number of plague deaths per week. Notably, during 1638 and 1639, the weekly death counts were relatively low, with most deaths concentrated between weeks 30 and 47. The weeks with higher death counts are coloured in a darker shade of blue. Figure 2 shows a spatial representation of total plague burials per year. In both of the years studied, the plague remained mostly outside of the walled parishes, and had a greater impact in parishes without the walls and parishes in Middlesex/Surrey.
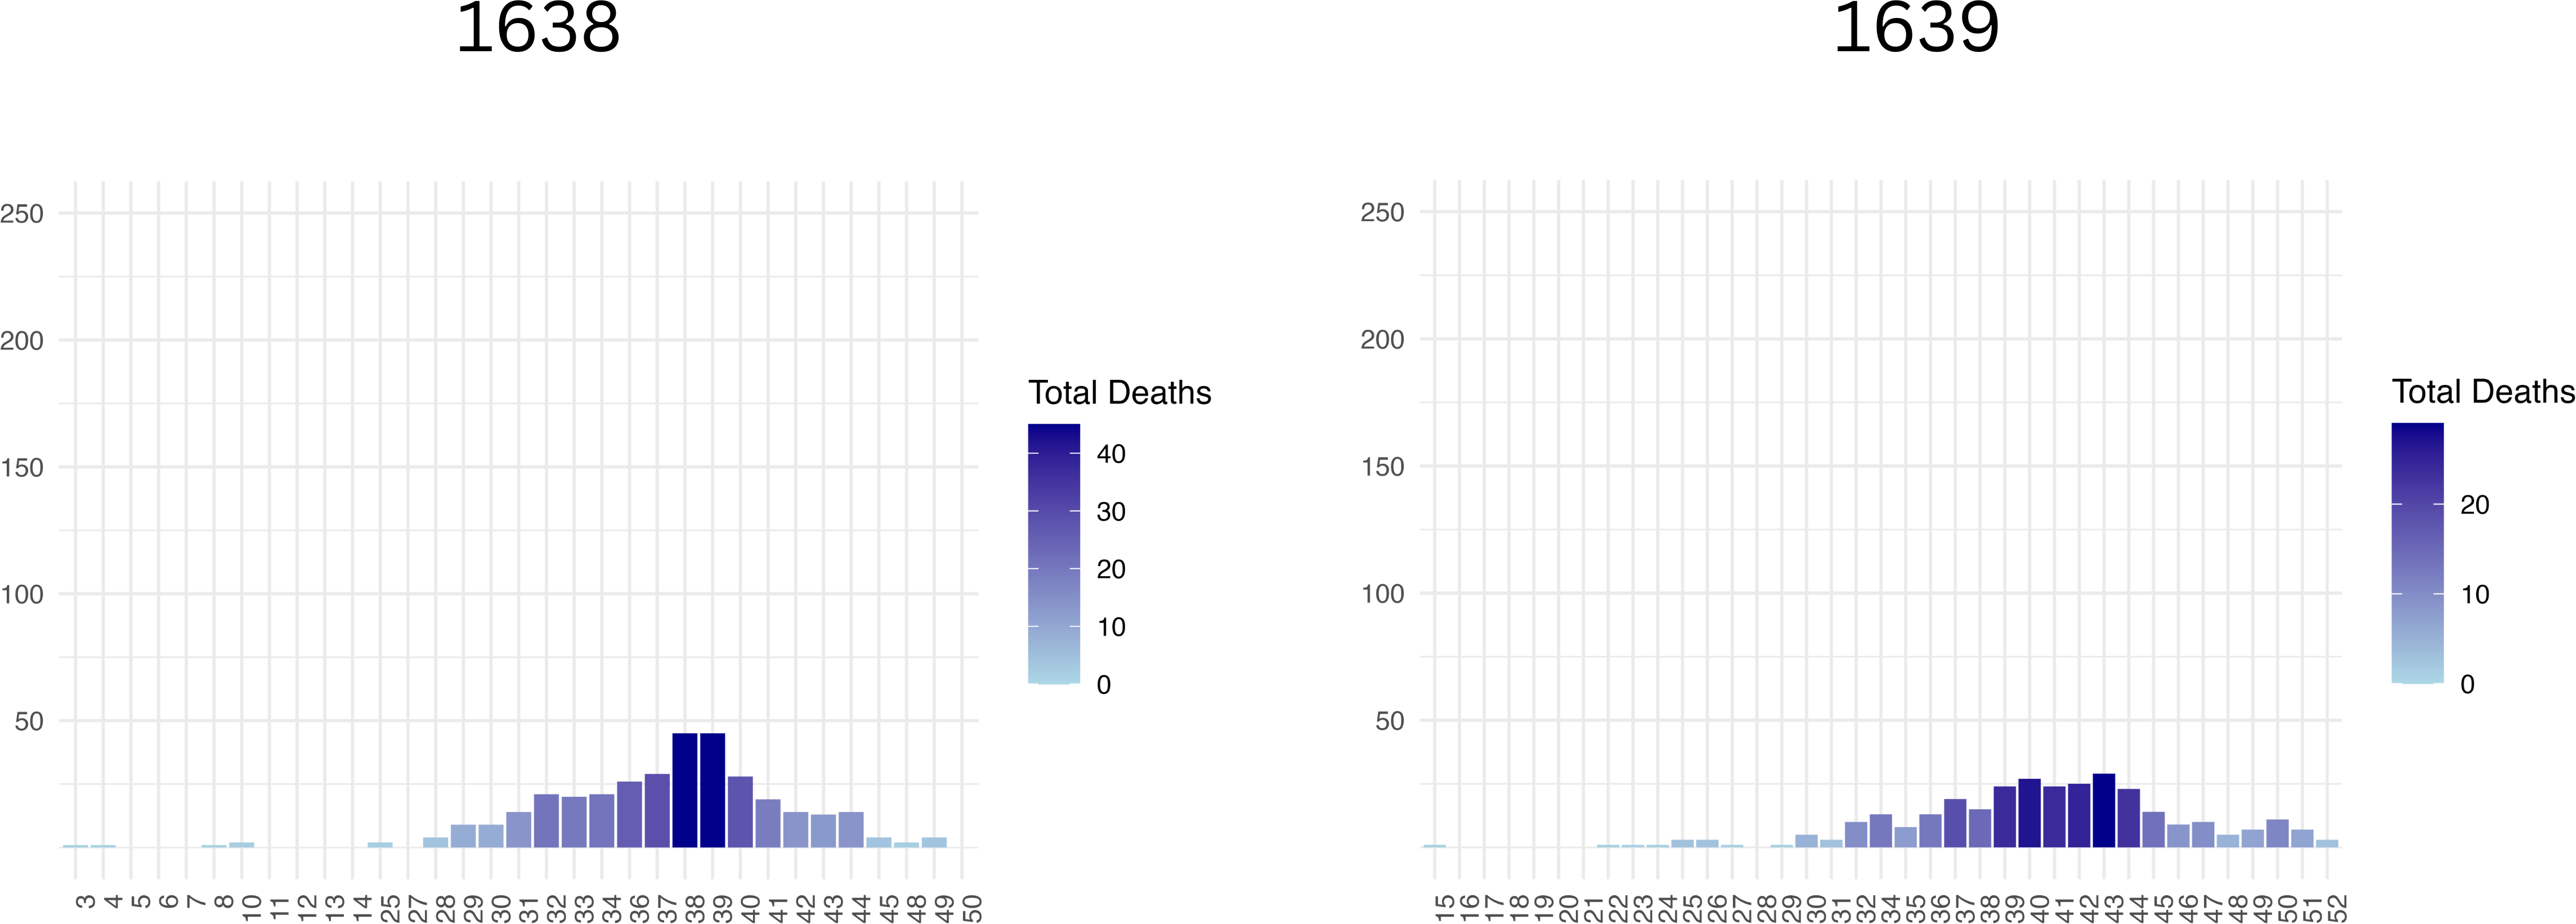
Figure 1. Bar plot with annual trends. The plot shows plague fatalities for 1638 and 1639, by week. During 1638-1639, the weekly deaths were markedly low, with a concentration of deaths occurring between weeks 30 and 47. Weeks with higher death counts are depicted in a darker shade of blue.
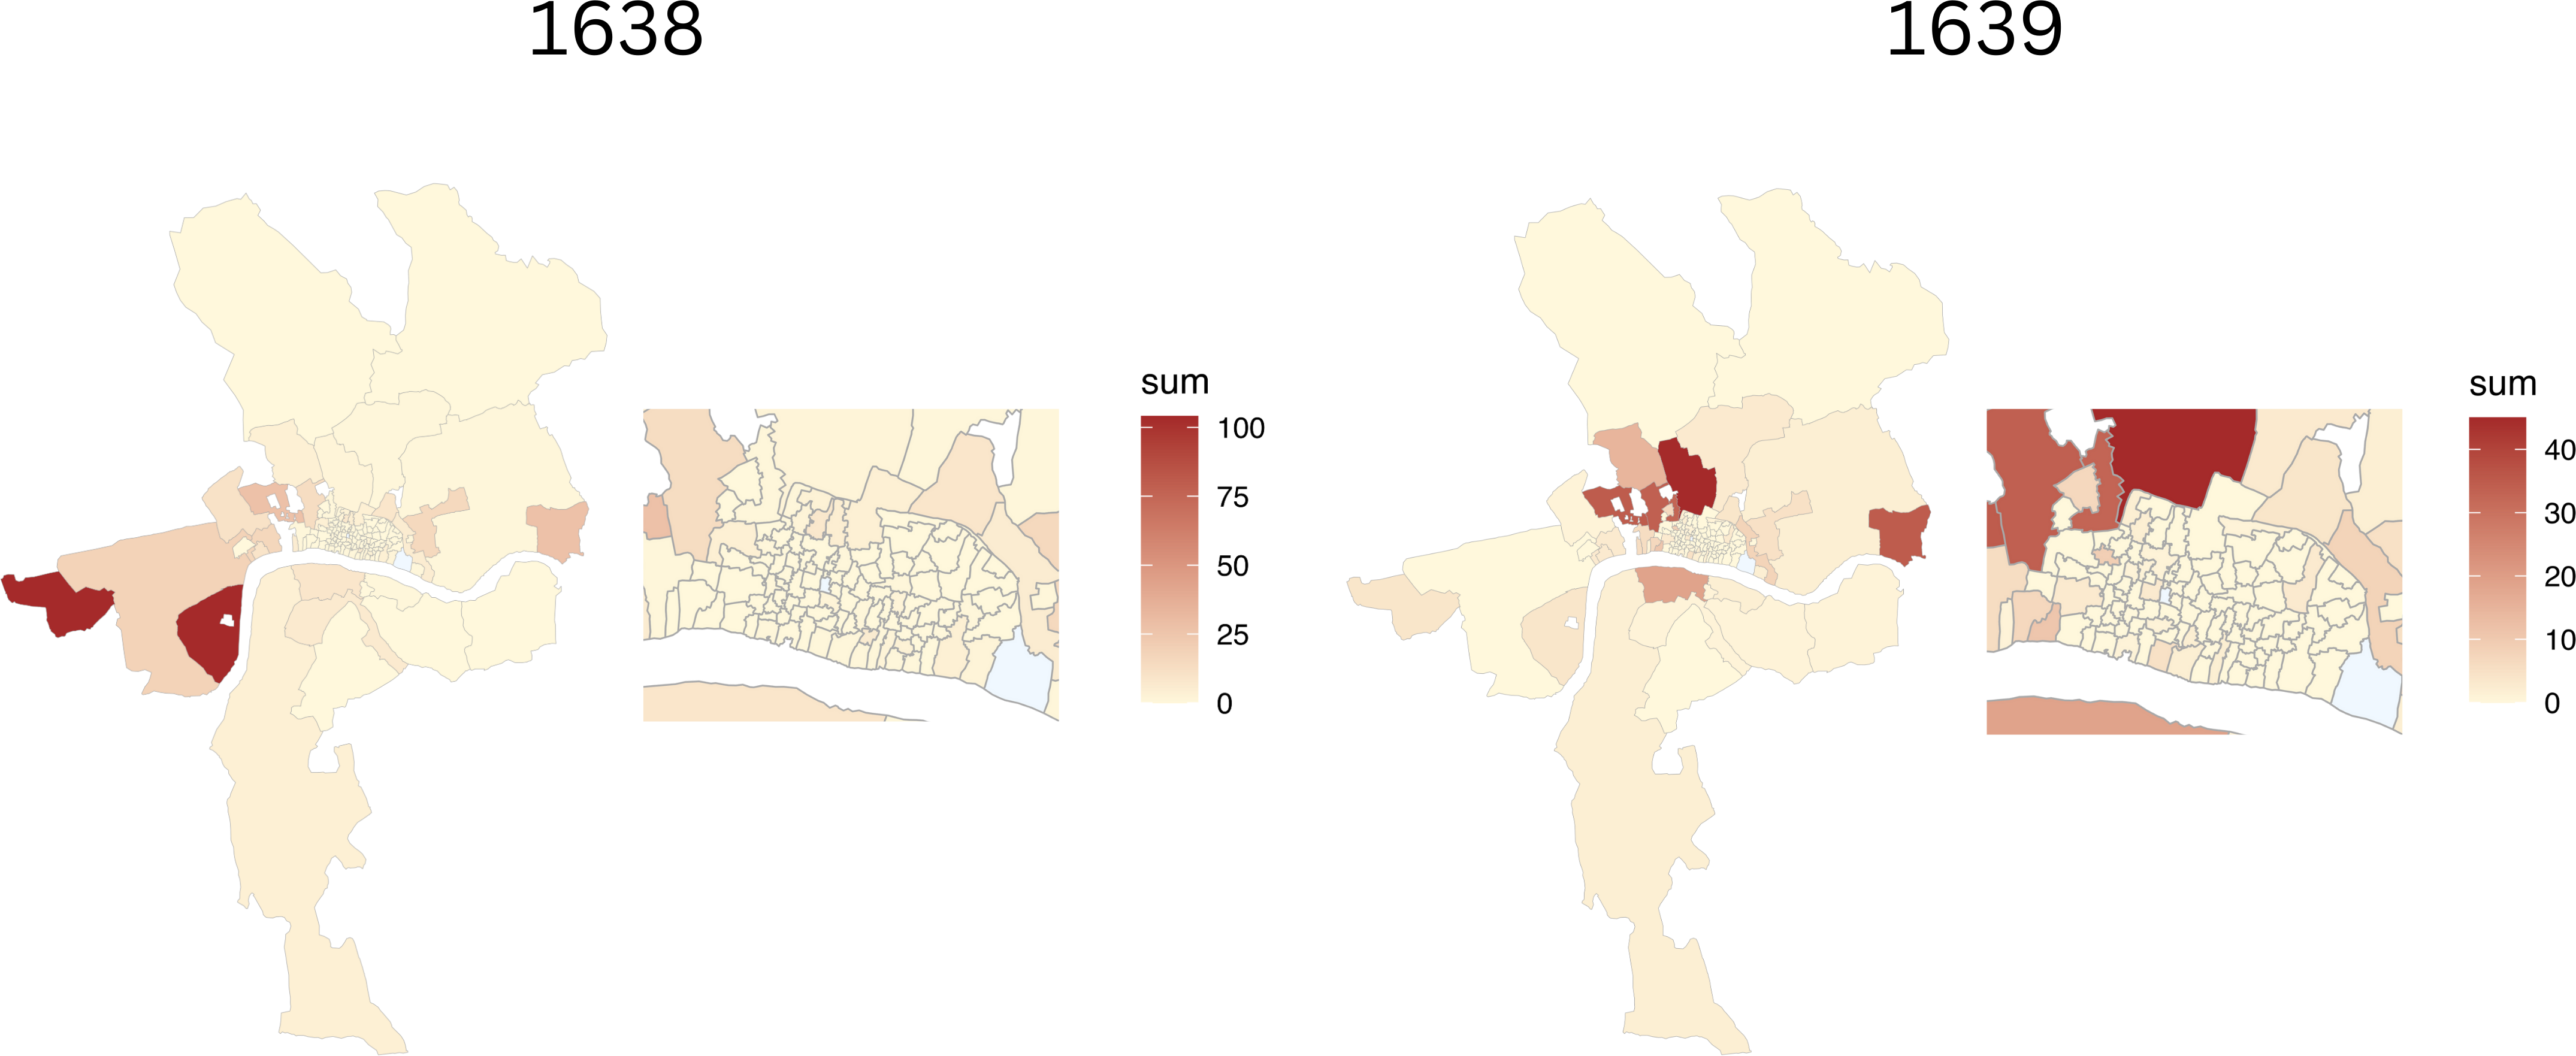
Figure 2. Spatial representation of total plague burials for 1638-1639. In 1638, St. Margaret Westminster recorded 104 plague fatalities, making it the location with the highest number of deaths. The following year, in 1639, St. Giles Cripplegate saw the most plague burials, with a total of 45.
The survival curves for 1638 and 1639 suggest that the differences in how the plague impacted the four groups of parishes remained somewhat consistent in magnitude. A prominent feature is that the walled parishes continued unimpacted by the plague for almost half a year. This differs greatly from the outbreak of 1636, where all four groups of parishes reported deaths within the initial 5 weeks. Although the spatial pattern is similar compared to the 1636’s outbreak –a slower spread within the walls of London and a higher intensity in the surrounding areas– the fact that in 1638-1639 the plague showed up within the walls by late summer stands out as a significant difference. Despite the absence of data from late 1636 and 1637, it is likely that the factors responsible for the lesser impact of the plague within the walled parishes also contributed to mitigating the spread of the plague in these areas in 1638 and 1639. Figure 3 presents the time-to-event distributions for the four groups of parishes during 1638 and 1639. Notably, parishes within the walls only began reporting plague cases after week 23 and 25. In 1638, only 29 of the 97 parishes within the walls (group 1) reported a plague death; this number decreased further in 1639, with only 19 parishes reporting deaths. This is a significant contrast to the outbreak in 1636 and the widespread plague deaths in the 1640s, where most parishes in these groups experienced at least one death early in the year.
In the years 1638 and 1639, both group 2 (without the walls) and group 3 (Middlesex/Surrey) struggled with significantly higher mortality rates than group 1. The situation for group 2 appears to be deteriorating more rapidly than for group 3, suggesting potential differences in exposure, susceptibility, or the presence of demographic trends boosting the spread of the plague. Group 4, corresponding to the outer parishes of Westminster, appeared to be less impacted by the factors affecting group 2 and group 3, suggesting unique characteristics that insulate these parishes from broader London’s population trends. Figure 4 is a spatial representation of the duration data, which corresponds to a spatial representation of the time-to-event-analysis. The parishes in dark blue experienced the plague during the initial 10 weeks. As in the 1636’s outbreak, the parishes within the walls remained relatively unharmed by the plague.
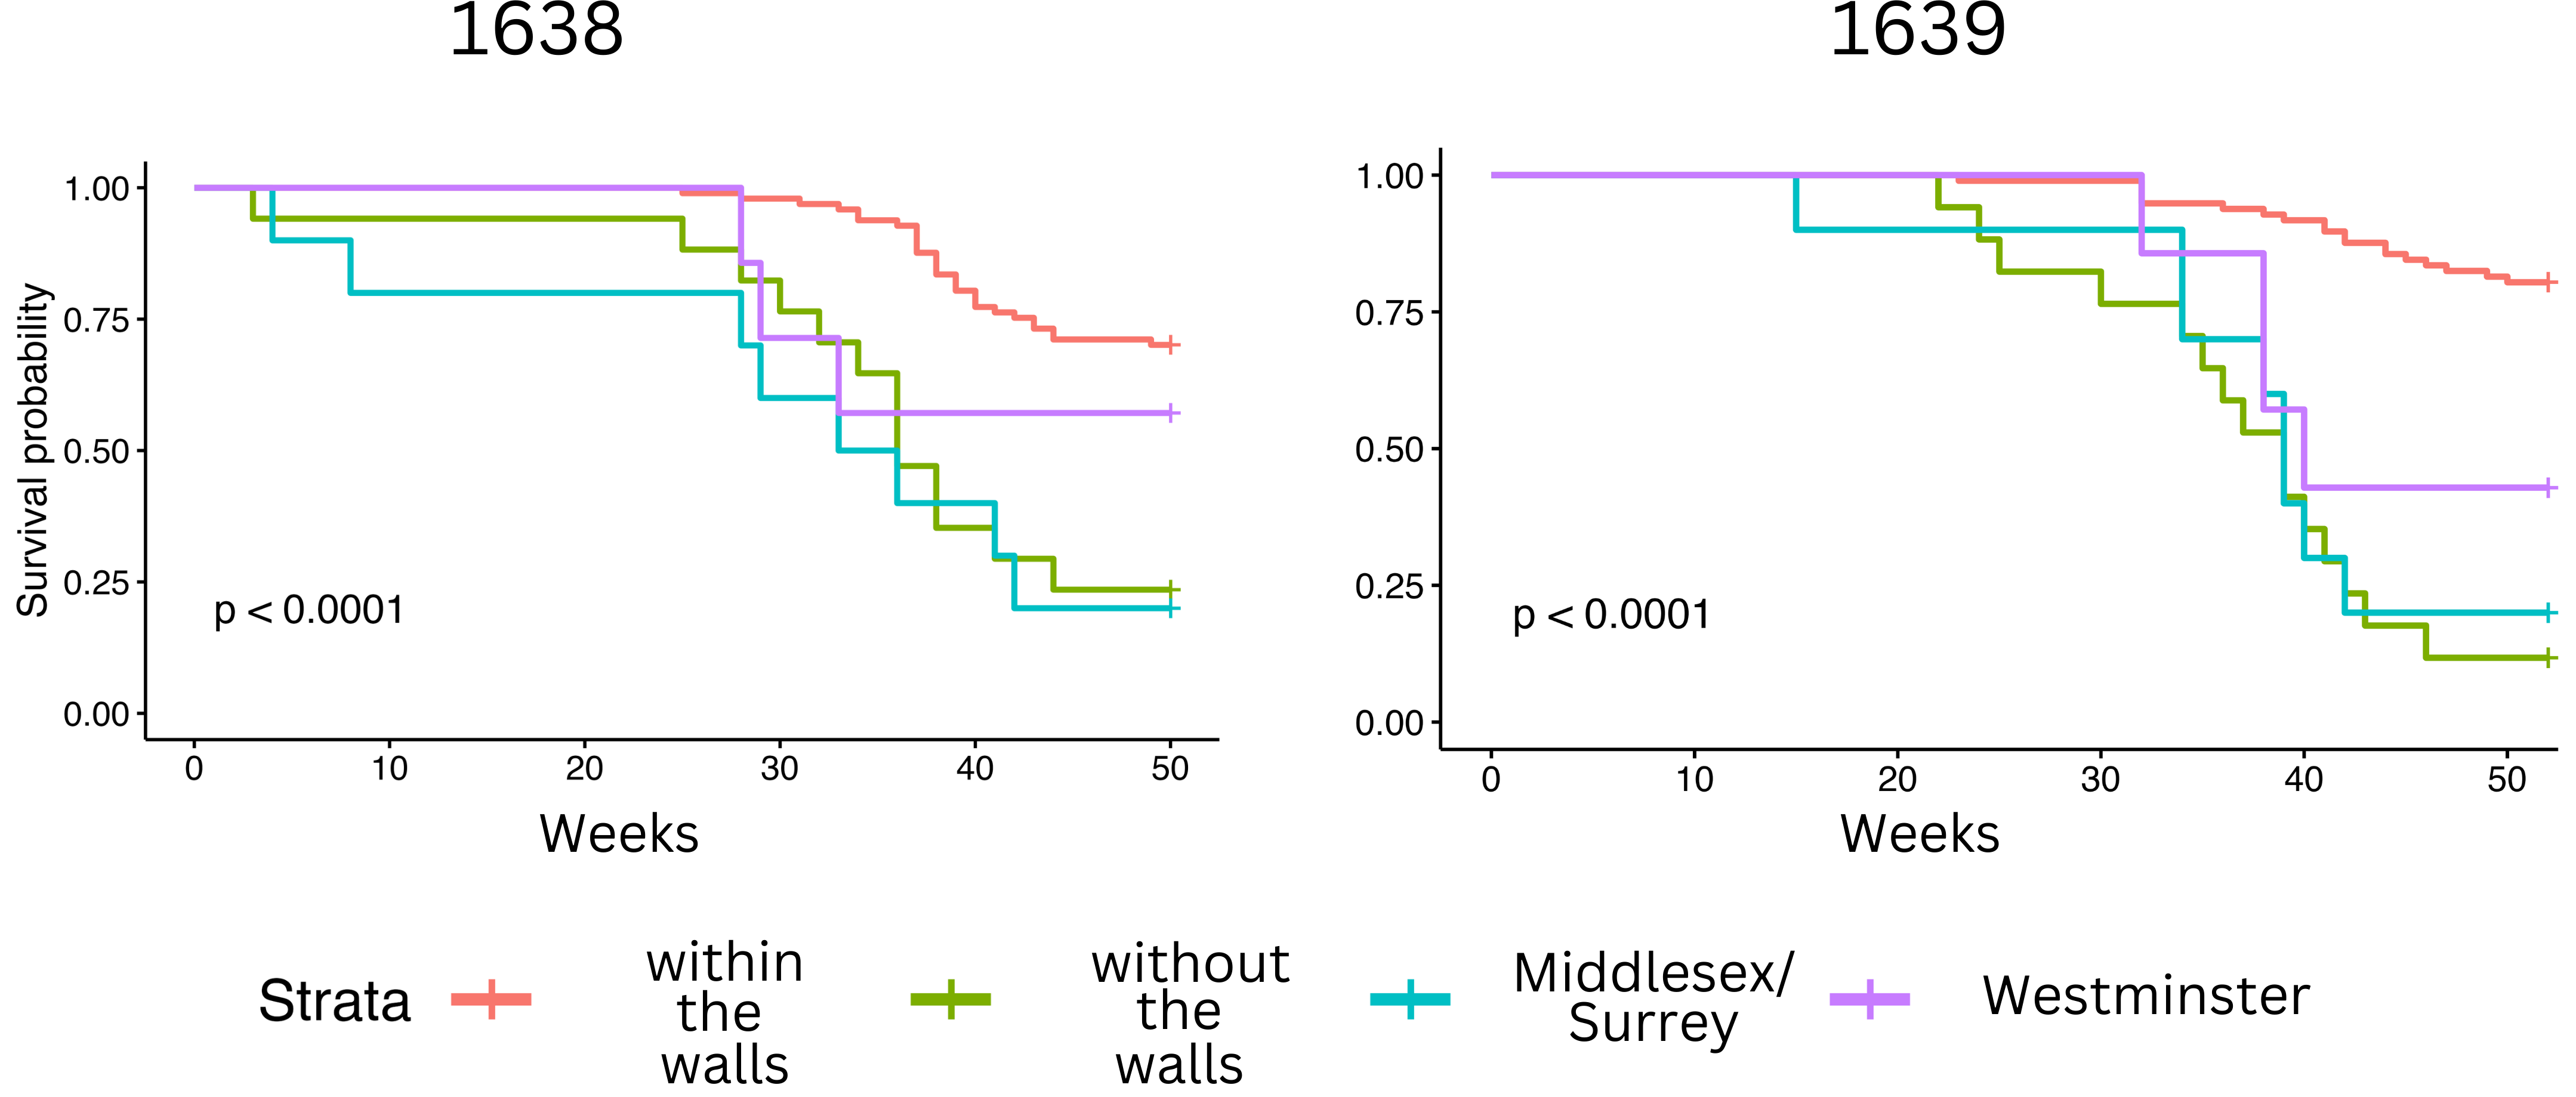
Figure 3. Time-to-event distributions of the 4 groups of parishes between the years 1638-1639. The parishes within the walls (group 1, in red) reported cases only after the 22nd week. In 1639, merely 19 of the 97 walled parishes reported plague fatality.
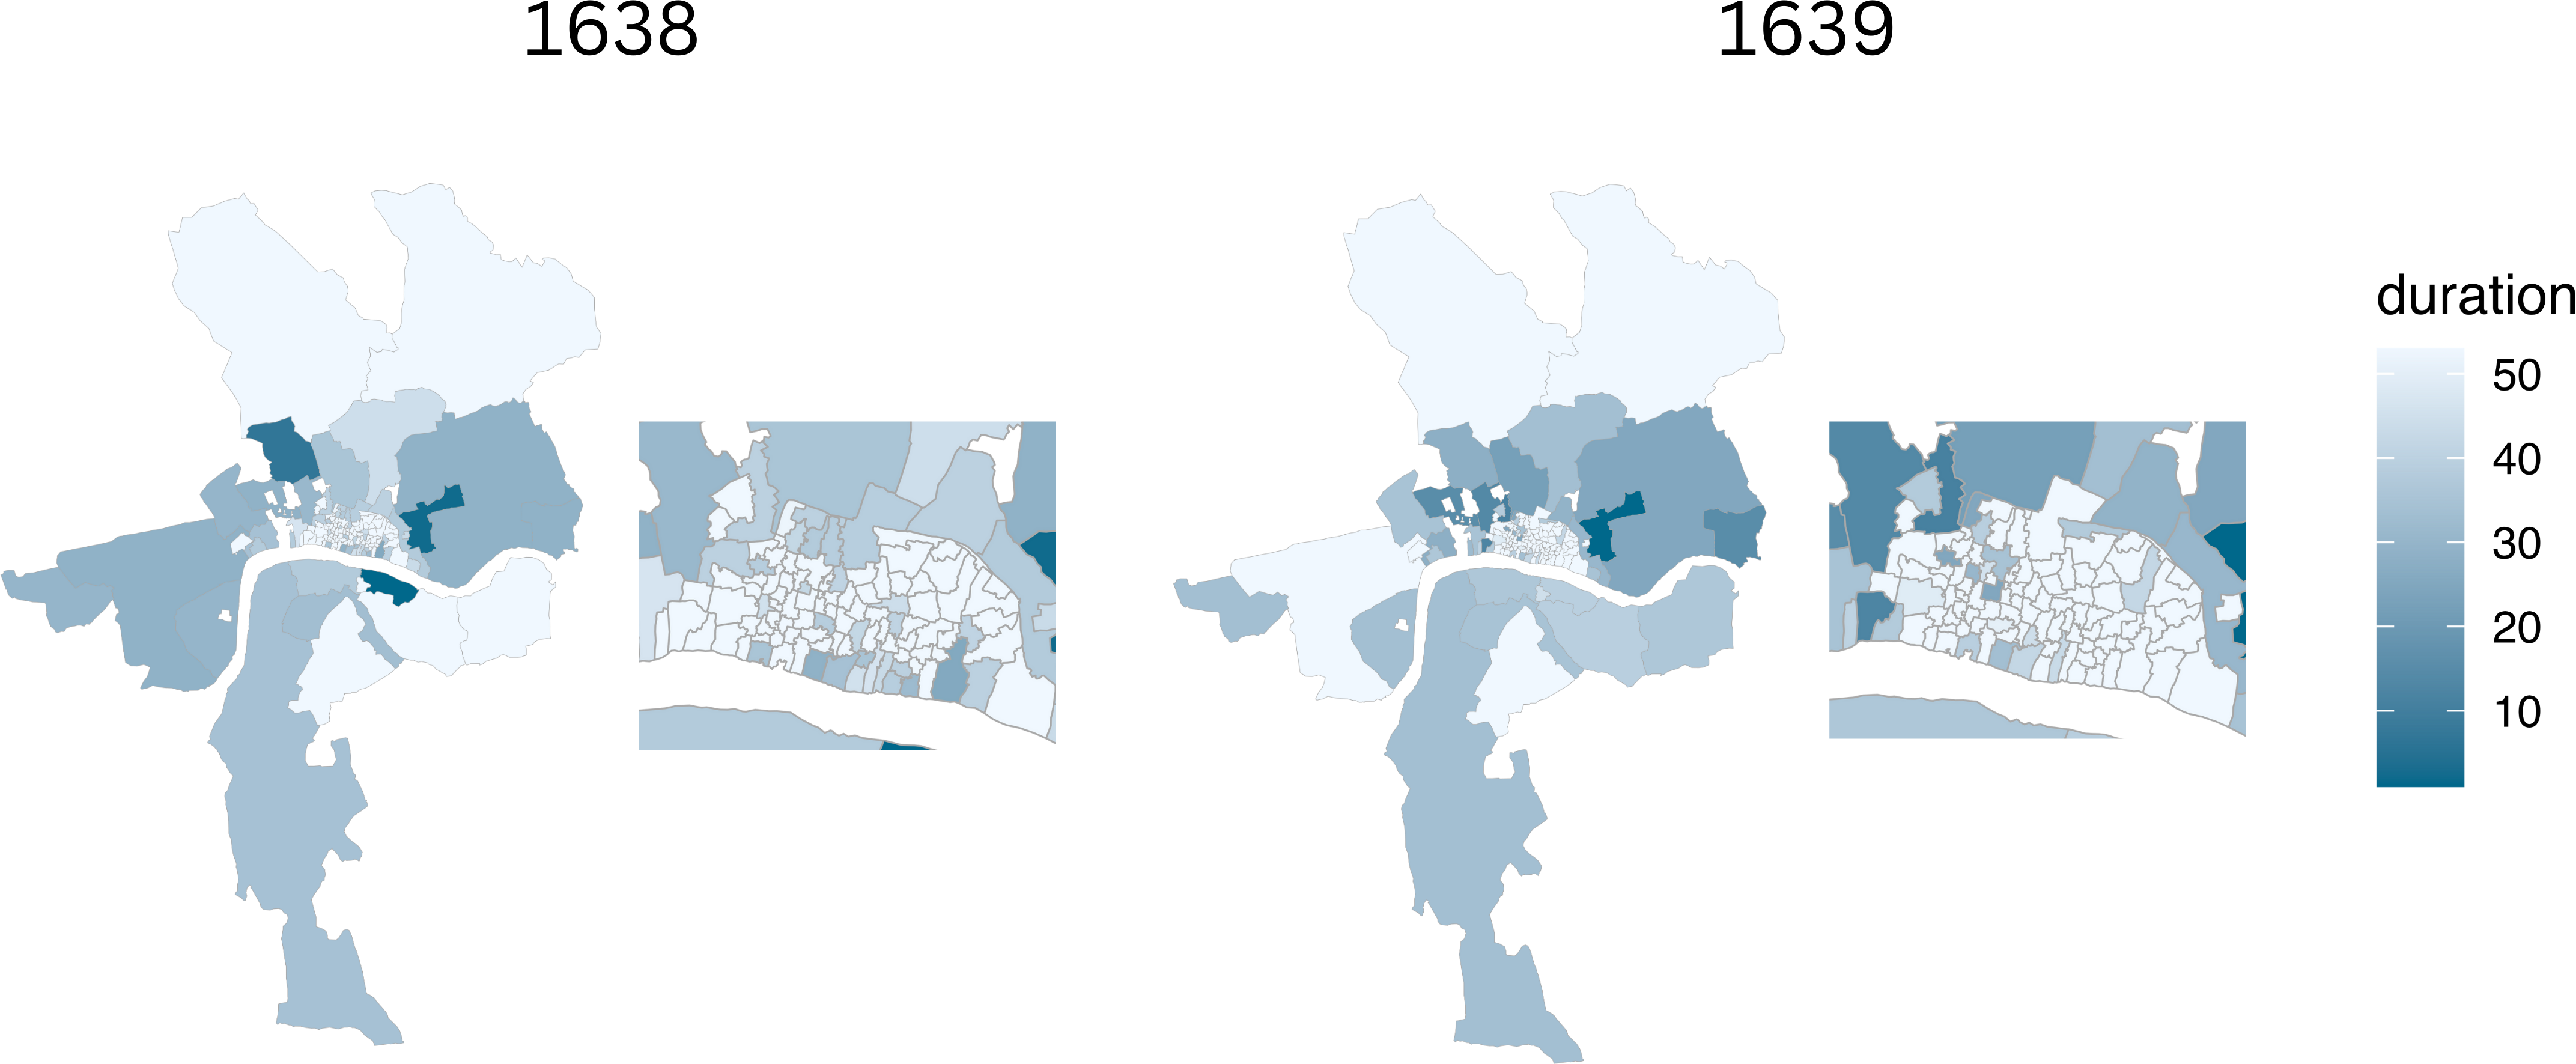
Figure 4. Spatial representation of the time-to-event analysis for 1638-1639. On the map, parishes shown in dark blue experienced the plague between the first 10 weeks. The lighter the shade, the later a parish reported its first plague case. Only a few parishes within the walls had plague cases in the first twenty-five weeks, whereas the majority of the parishes outside the walls—including the 16 without walls and the 9 in Middlesex and Surrey—reported cases earlier, before the 20th week.
- The plague in 1642, 1644, 1646 and 1647
The second set of years is marked by a notable increase in the strength of the plague incidences. Annual deaths during this period show a dramatic growth compared to the late 1630s, totalling 1803 deaths in 1642, 1579 in 1644, 2205 in 1646, and 3473 in 1647. In the 1640s, the higher weekly death counts were predominantly concentrated between weeks 33 and 44, from early September to mid October. In fact, from 1642 on, data shows that there was at least one plague death each week of the year. Differently put: throughout the years 1642, 1644, 1646, and 1647, the threat of the plague never abandoned London. Figure 5 displays a histogram with the weekly deaths for the years studied. Figure 6 displays a spatial representation of total plague burials over the four years studied. Similar to the late 1630s, none of the parishes within the city walls recorded the highest number of burials during these years.
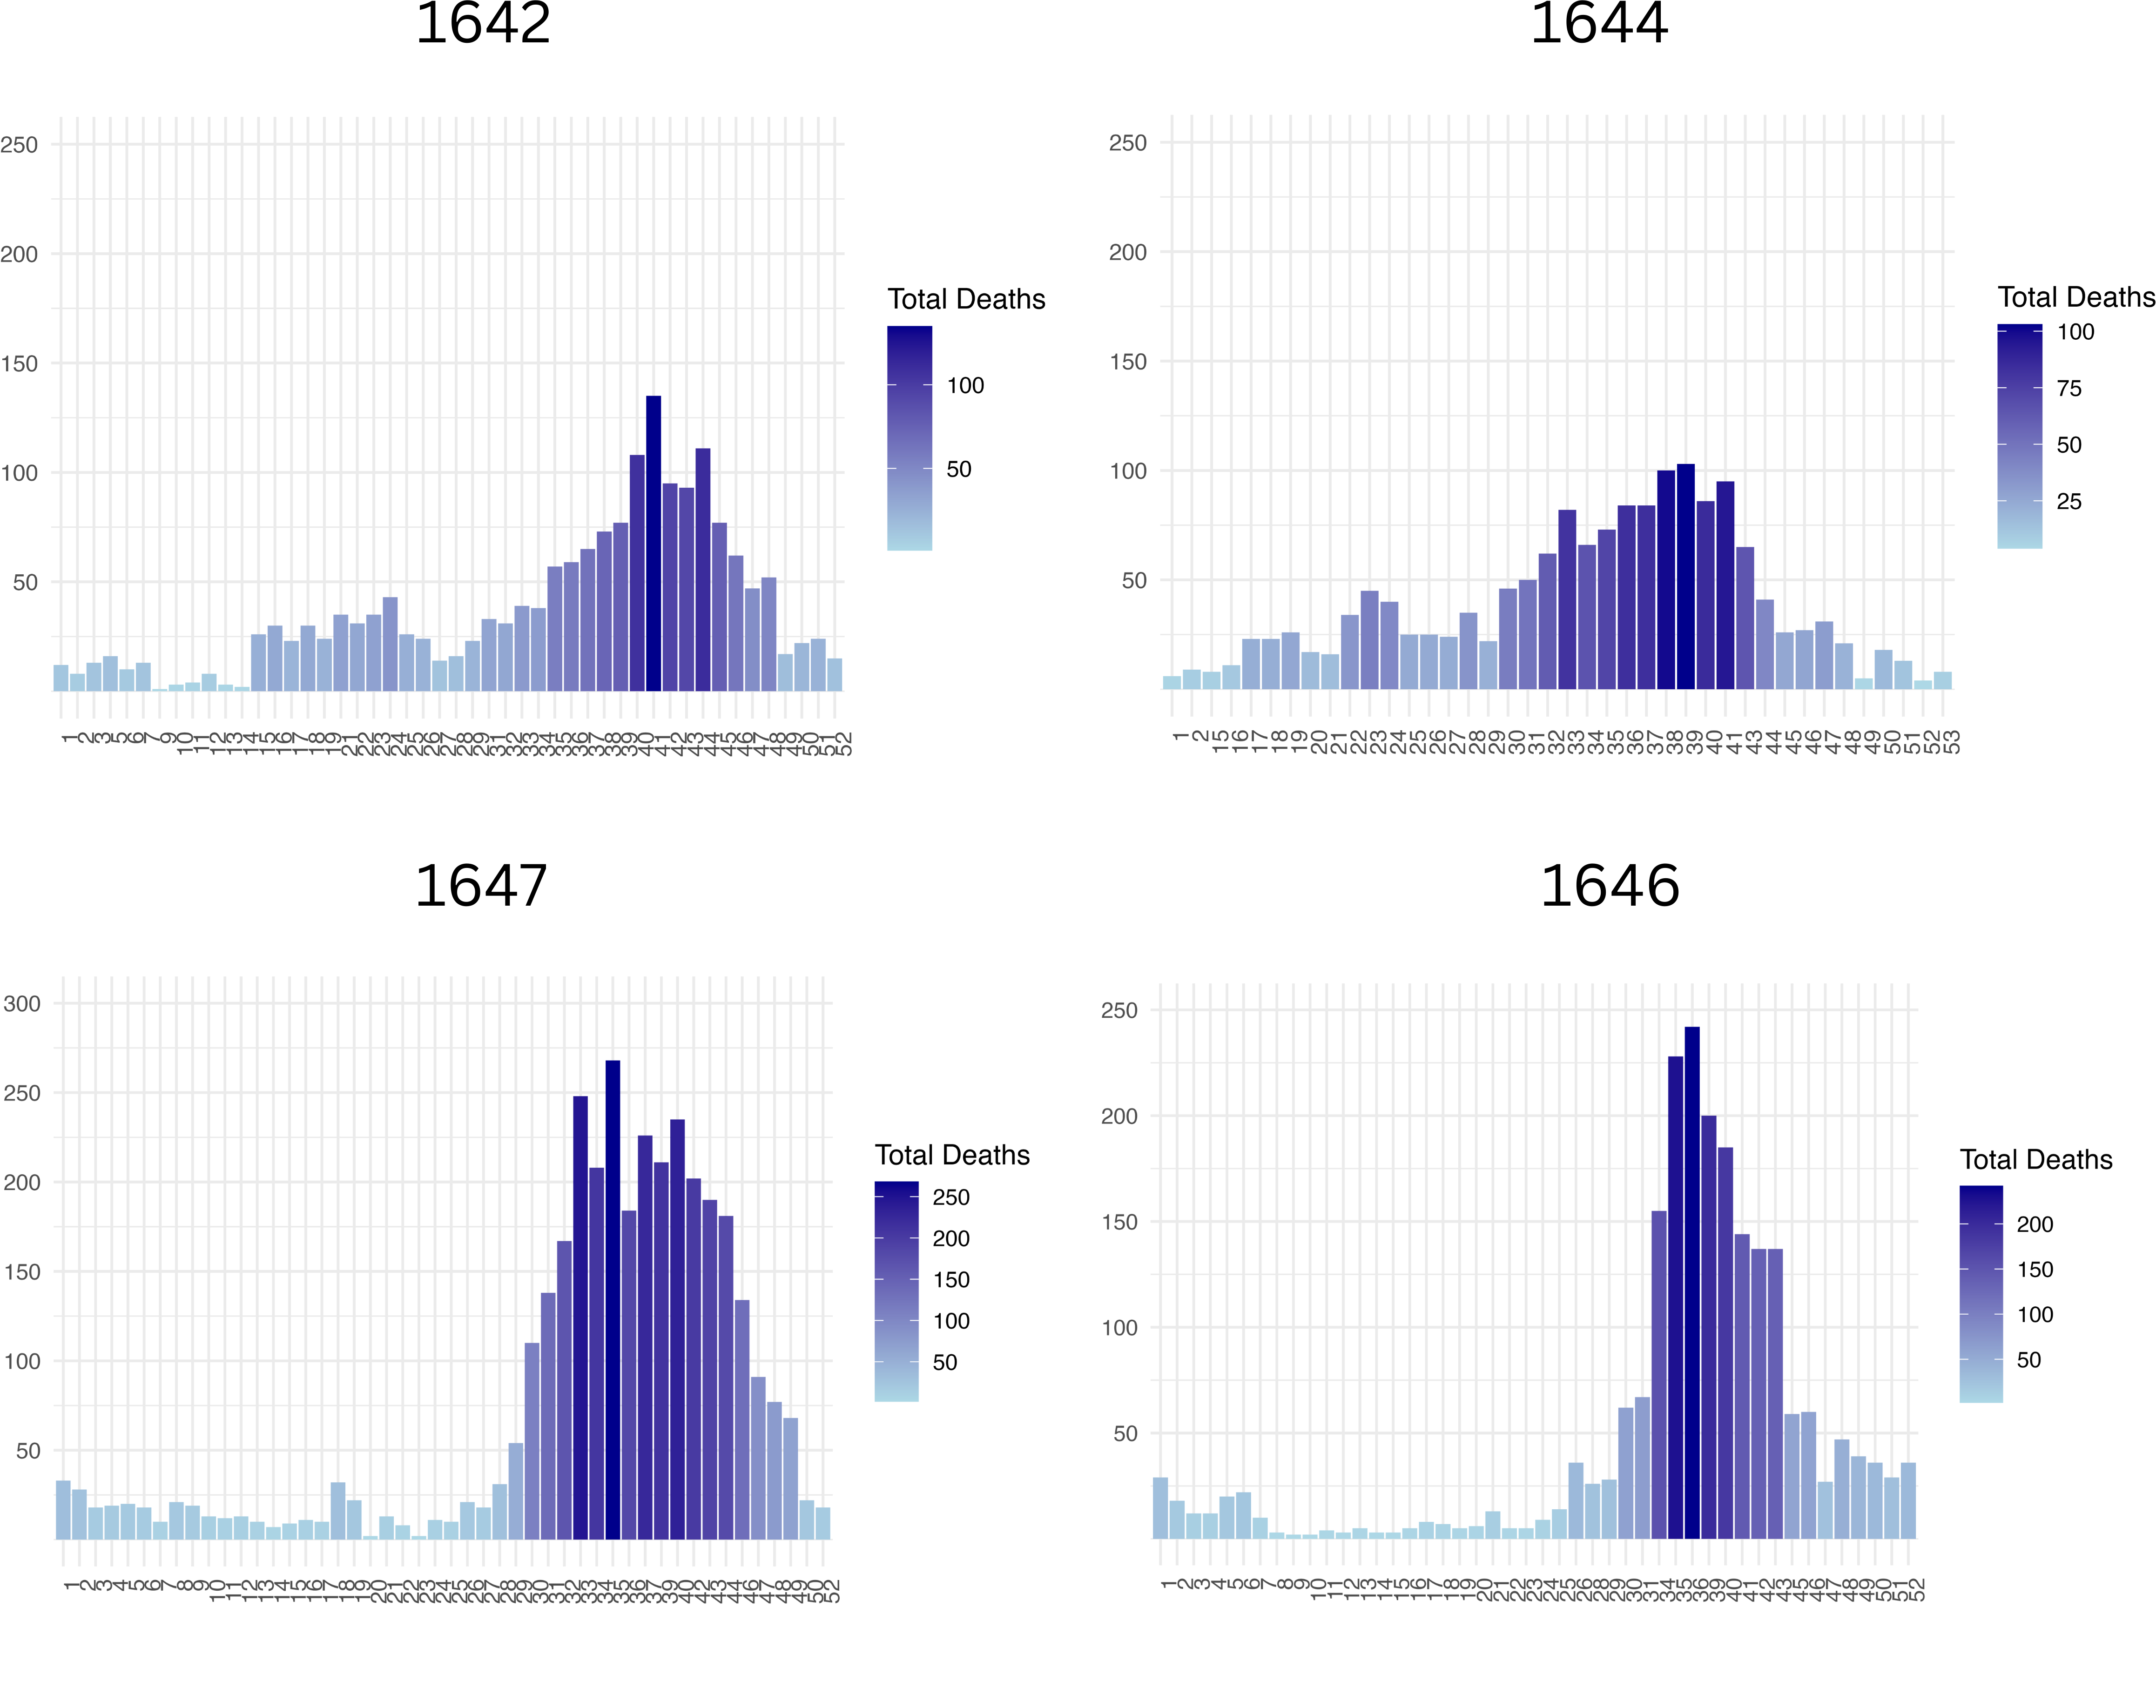
Figure 5. Weekly deaths for the years 1642, 1644, 1646 and 1647. The image features a histogram outlining the weekly death tolls for the years under review. The weekly deaths predominantly occurred between weeks 33 and 44.
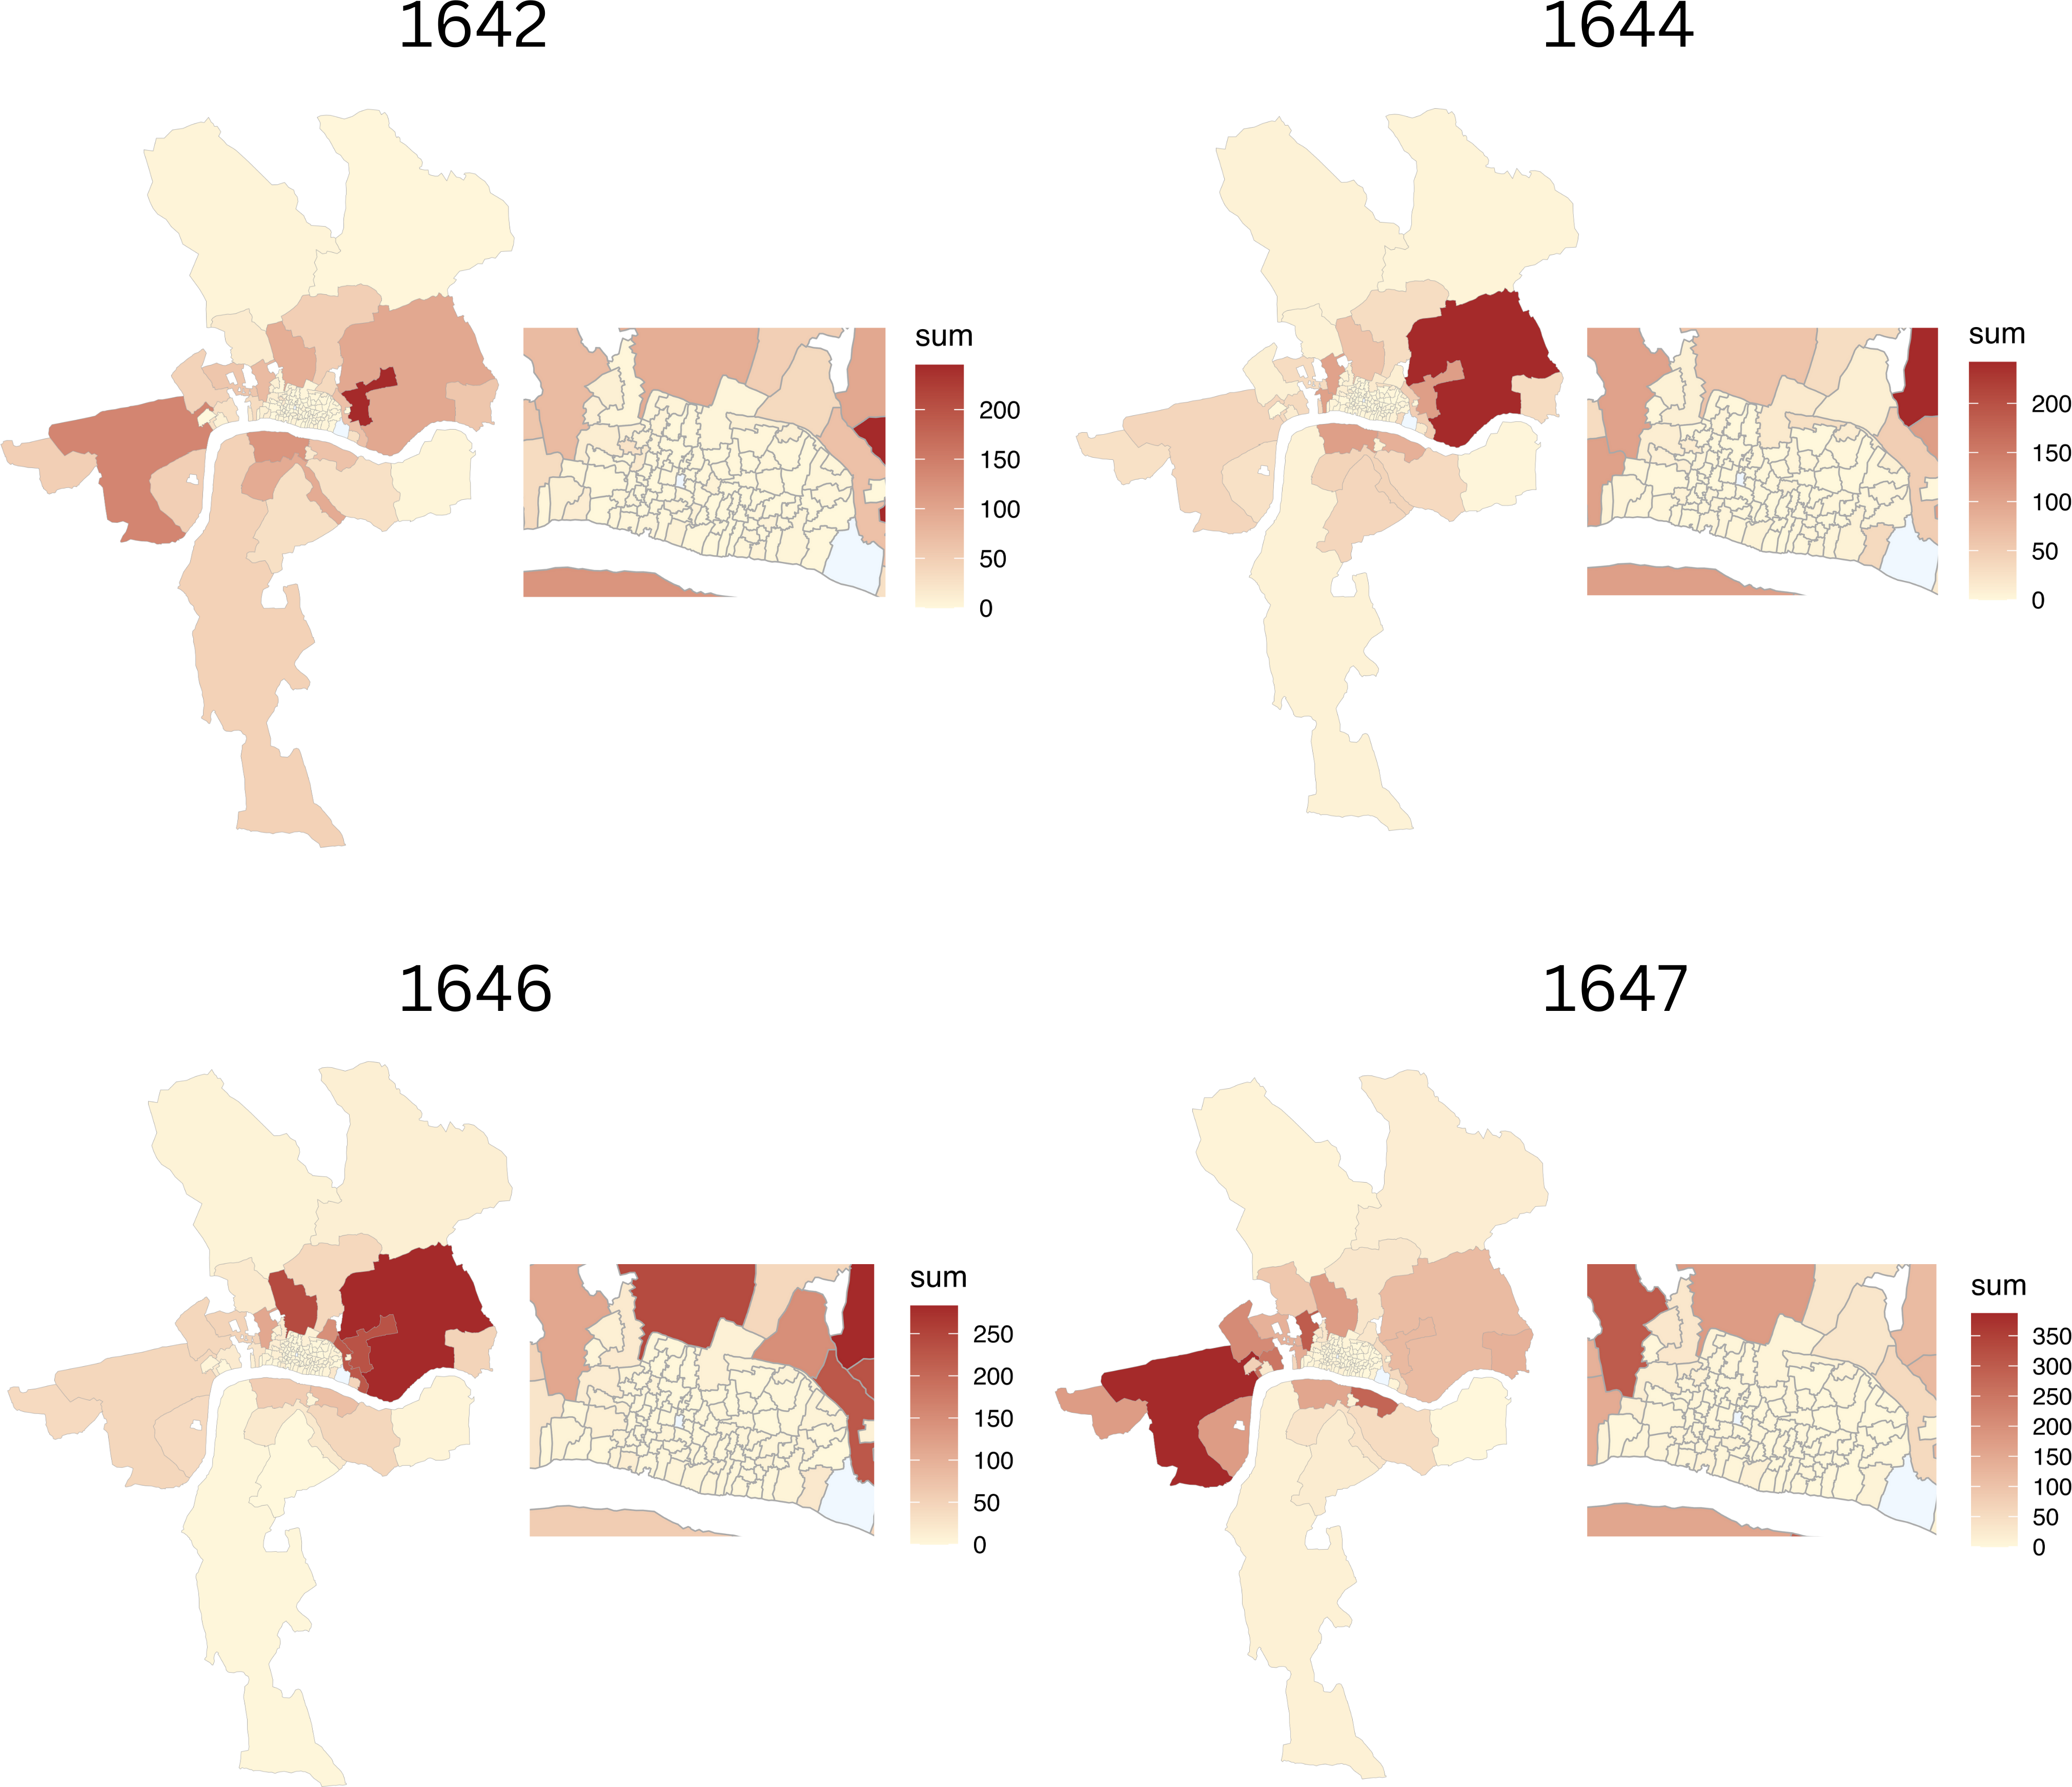
Figure 6. Spatial representation of total plague burials during 1642, 1644, 1646, 1647. None of the parishes within the city walls recorded a high number of burials. The parishes with the most deaths in these years were St Mary Whitechappel (1642), Stepney Parish (1644, 1646) and St Martin in the fields (1647).
The analysis of the groups of parishes indicates a growing difference between the survival rates for all groups year by year during the 1640s. The year 1647 registered the highest chi-square value and the lowest p-value, two metrics used in hypothesis testing in the context of time-to-event analysis, indicating that the differences between the survival curves of each group of parishes were becoming more significant.4 Figure 7 shows the time-to-event distributions for all parish groups during the years available in our data in the 1640s. Starting in 1642, every summer plague flare-up saw all parishes in groups 2, 3, and 4 reporting deaths during most of the weeks. In addition, the data reveals an escalating impact of the plague in group 1, corresponding to the parishes within the walls.1646 was the year that registered the most parishes with plague events, with 71 out of 97 parishes within the walls reporting at least one fatality. Figure 8 shows a spatial representation of the time to event analysis for the 1640s. The darker parishes reflect an early occurrence of at least one plague burial. It is interesting to note how a growing number of walled parishes, corresponding to group 1, experienced earlier occurrences of the plague by the years 1646 and 1647.
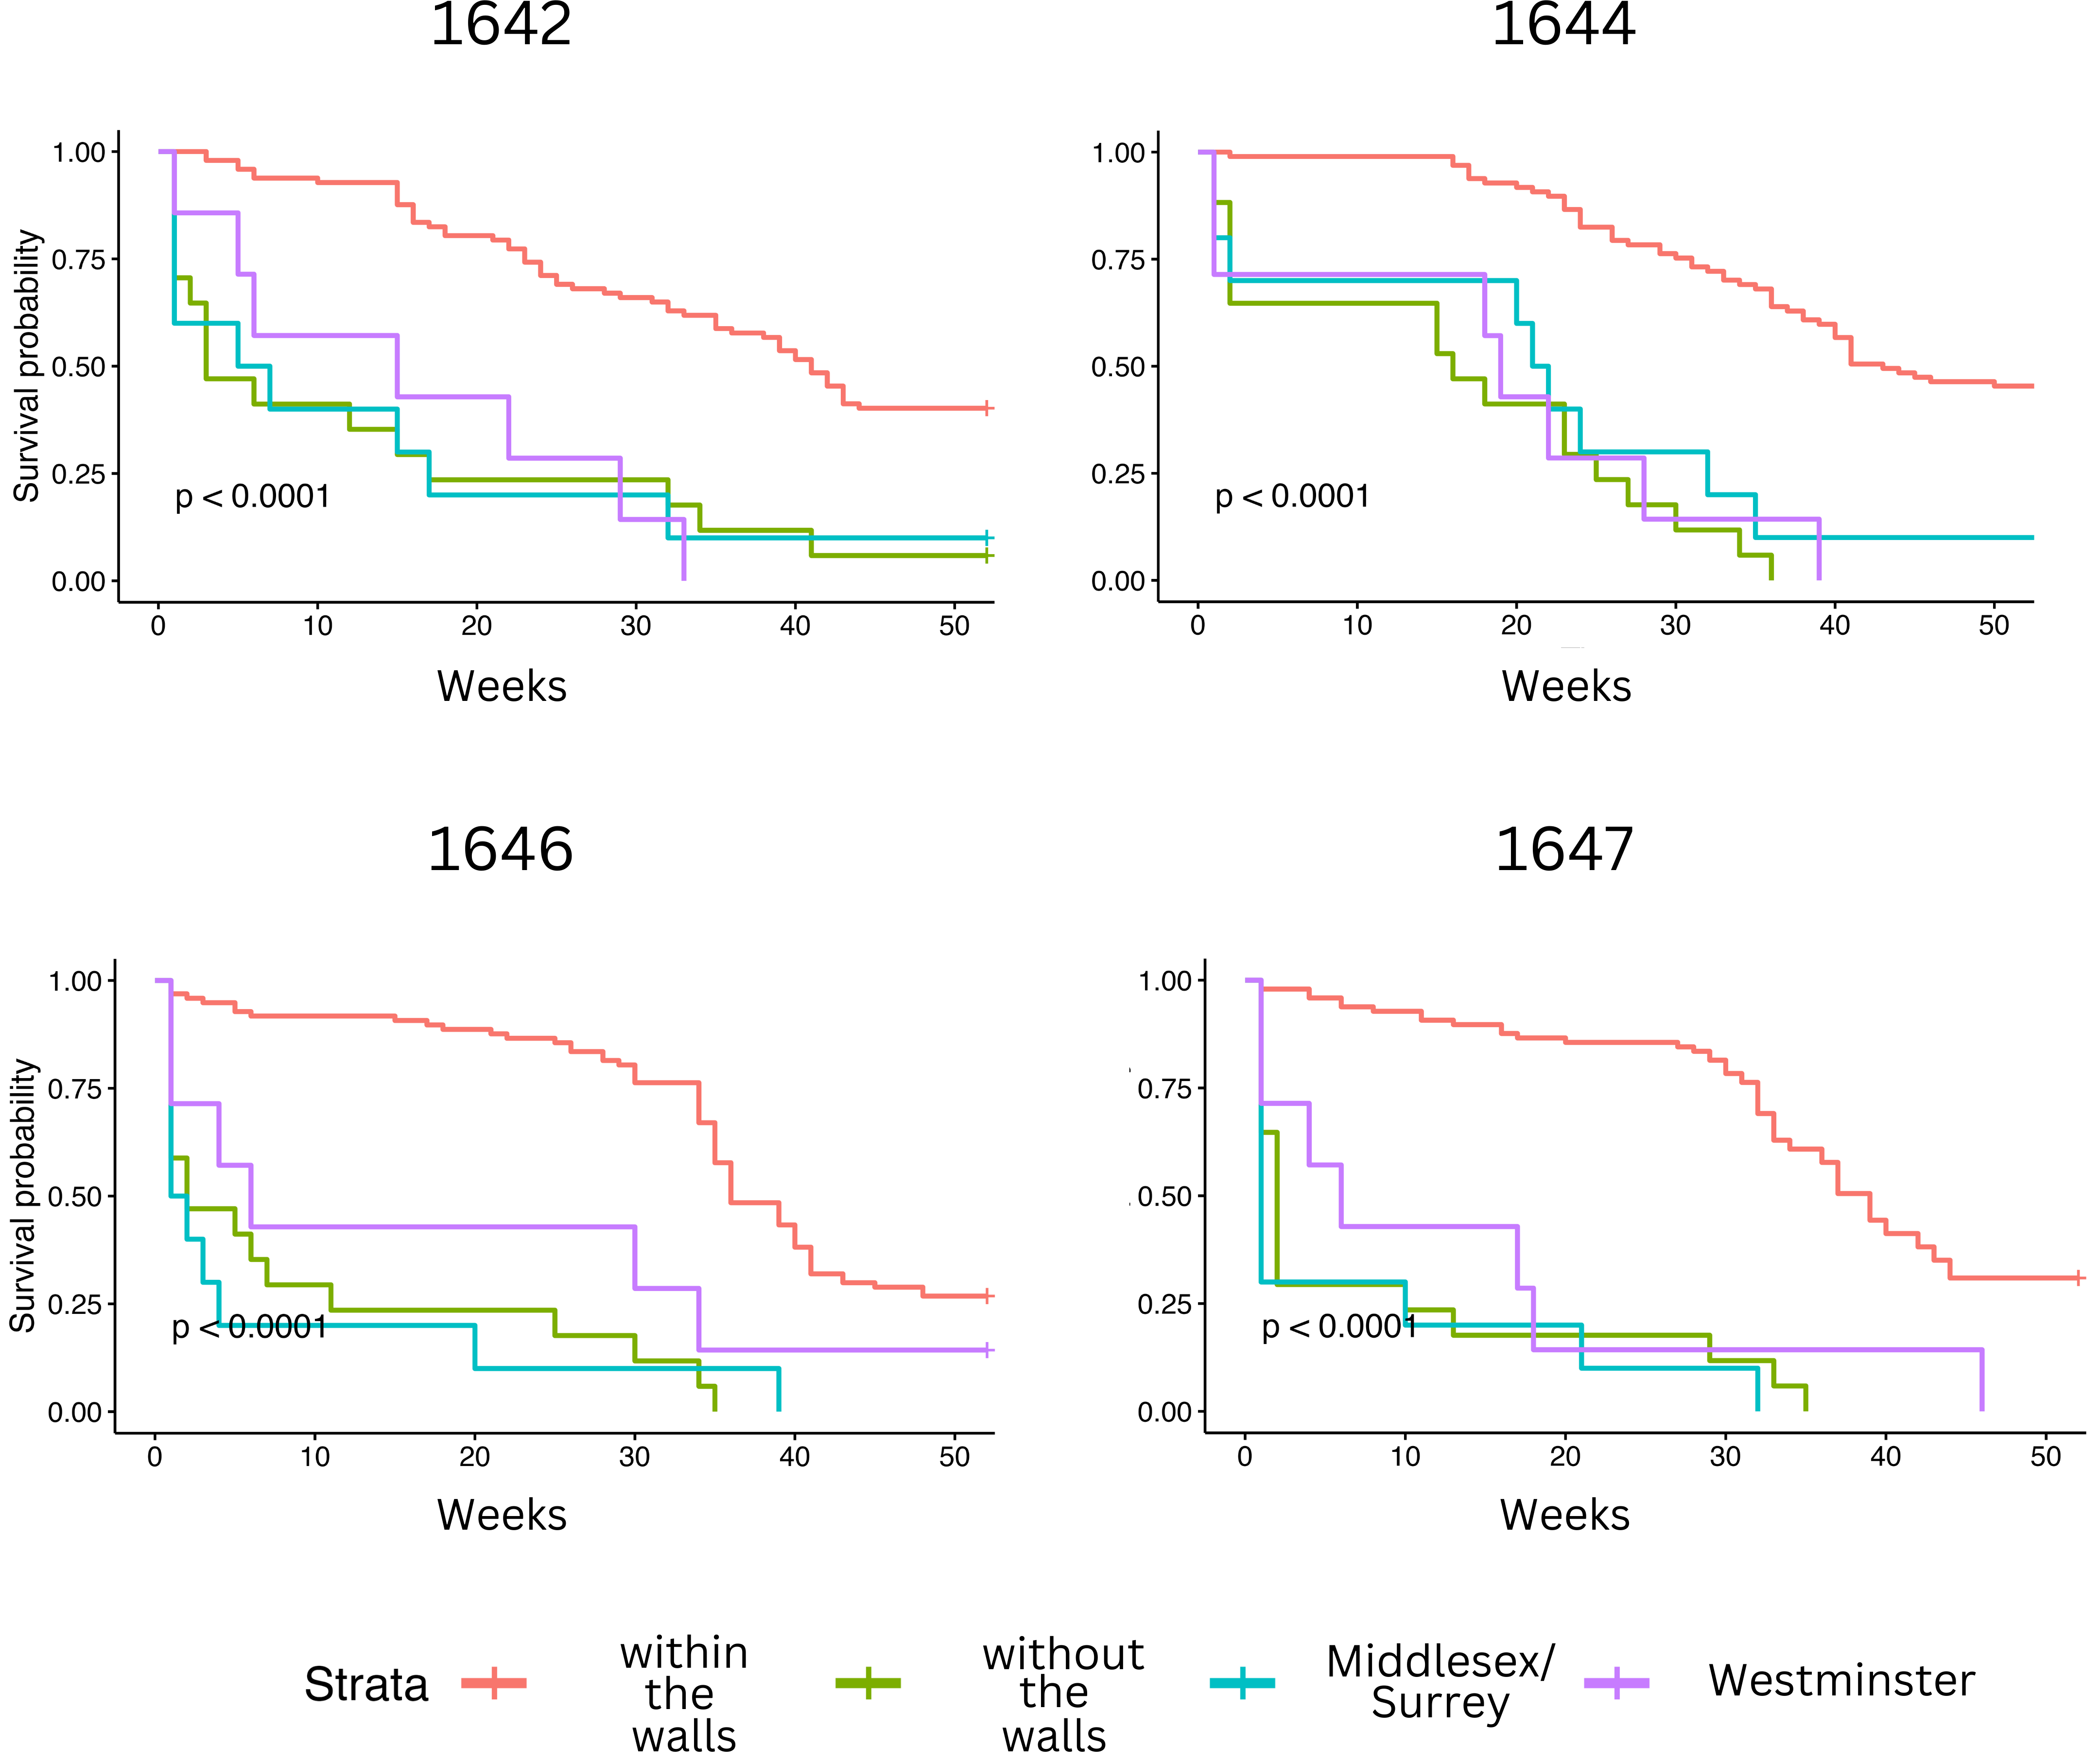
Figure 7. Time-to-event distributions for the years 1642, 1644, 1646 and 1647. Beginning in 1642, each summer saw a growing surge in plague deaths, affecting all parishes in groups. Note how all parish groups reported a fatality within the initial 5 years. Data shows a growing impact of the plague for the years 1646 and 1647.
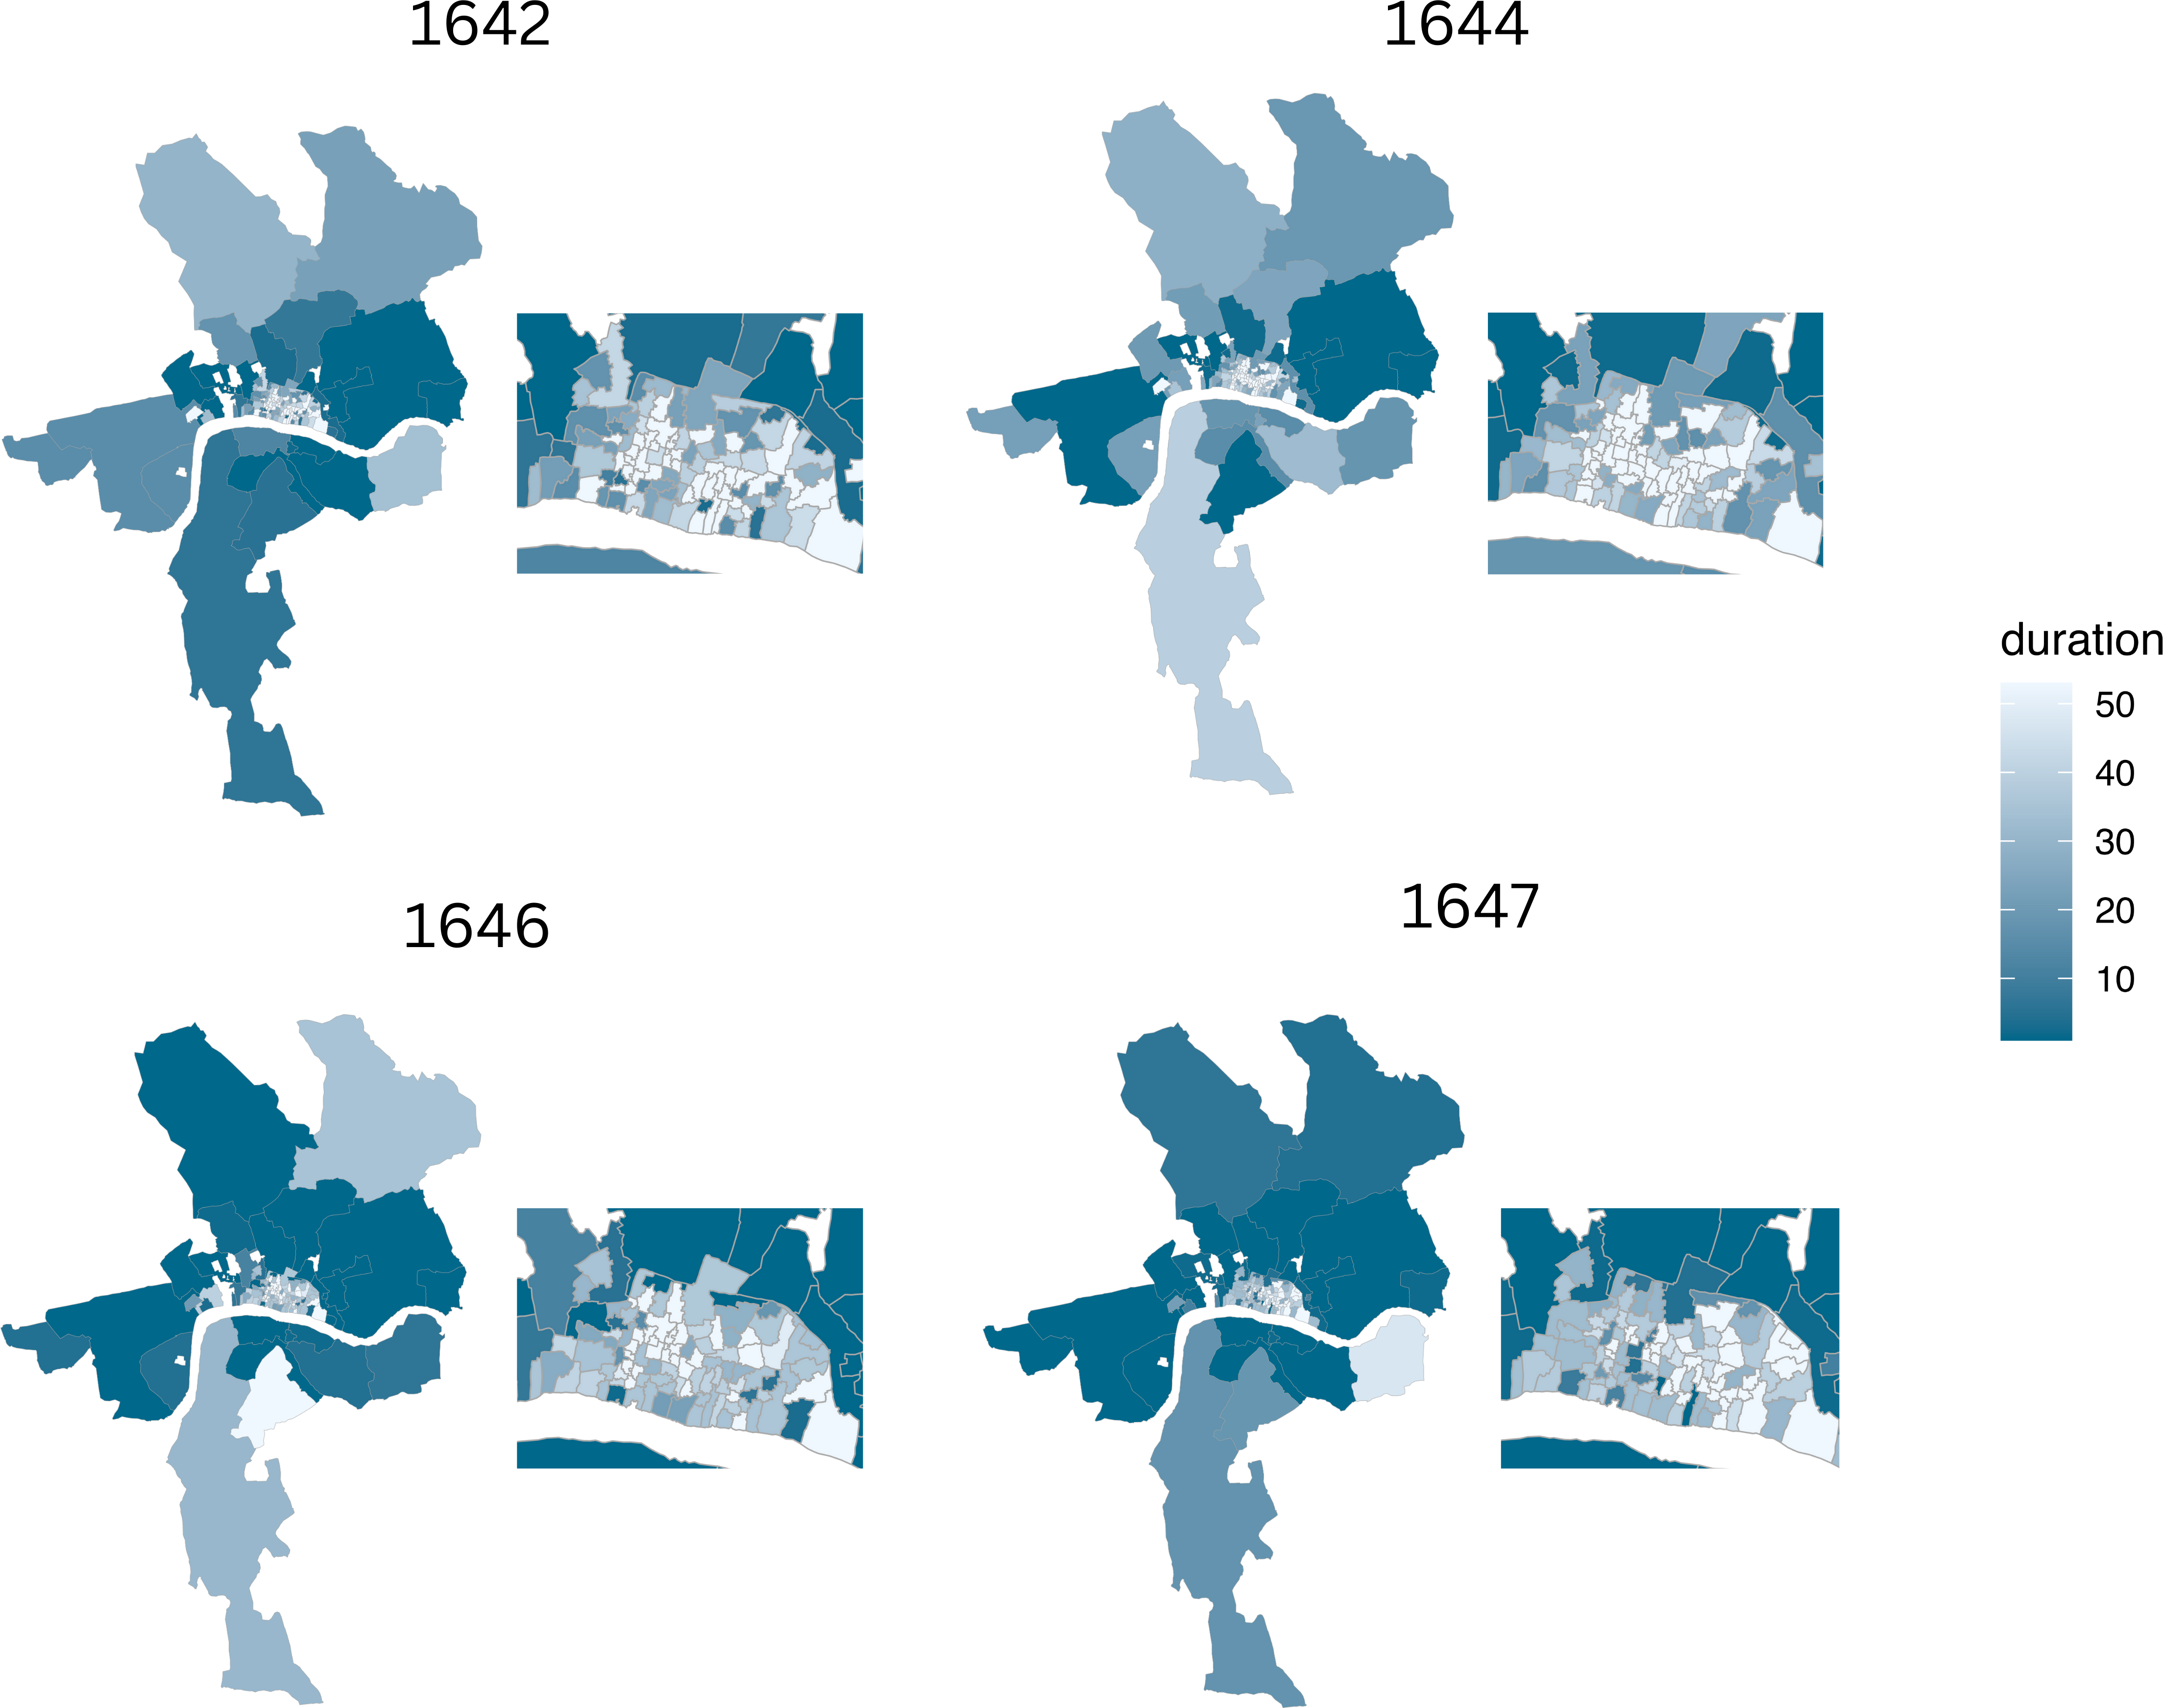
Figure 8. Spatial representation of the time-to-event analysis for 1642, 1644, 1646 and 1647. Parishes shown in dark blue experienced the plague between the first 10 weeks. As the decade progressed, the plague started to hit the parishes within the walls earlier in the year.
The survival distributions in figure 7 exhibit a pattern consistent with typical 17th-century plague outbreaks; two distincts curves, one for the parishes within the walls (red), and similar curves for the survival distributions of the suburban parishes of groups 2 (green) and 3 (turquoise). However, two differences stand out if we compare the outbreak of 1636 to the 1640s summer spikes. First, we see an early experience of the plague in most areas of London during the years studied in the 1640s decade. The curves show that all groups of parishes experienced fatalities in the initial 5 weeks of each year. Second, the curve corresponding to the 7 outer parishes in the City of Westminster, group 4 (purple), behaved almost like the curves of parish groups 2 and 3. In the 20 weeks analyzed for the 1636 outbreak, the outer parishes of Westminster stand in the middle between group 1, and groups 2 and 3. This could indicate that over time, conditions like demographic growth and public health interventions in Westminster increasingly aligned with those in the other groups.
The escalation of the plague can be tracked by analyzing spikes in deaths across different weeks. In 1642 and 1644, only during a couple of weeks did some parishes report spikes in plague deaths of ten or more fatalities. In contrast, during 1646 and 1647, six and nine parishes respectively reported such spikes. Notably, parishes like St. Clement Danes, St. Mary Whitechapel, and St Martin in the Fields experienced multiple weeks with significant increases in deaths. These sharp rises in fatalities occurred precisely when the plague was at its peak. However, none of the walled parishes in Group 1 reported spikes of 10 or more deaths during the study period, likely due to their lower population levels in comparison with the rest of London.
Analyzed biannually, 1641-1642 and 1646-1647 reported the occurrence of plague deaths in at least one parish in all weeks reported. Figure 9 depicts biannual bar plots for 1641-1642 and 1646-1647, illustrating the consistent presence of plague deaths in at least one parish every reported week during these periods. The plots highlight how the plague evolved into a ubiquitous and continuous threat, with both pairs of years showing pronounced increases in cases during the summer months.
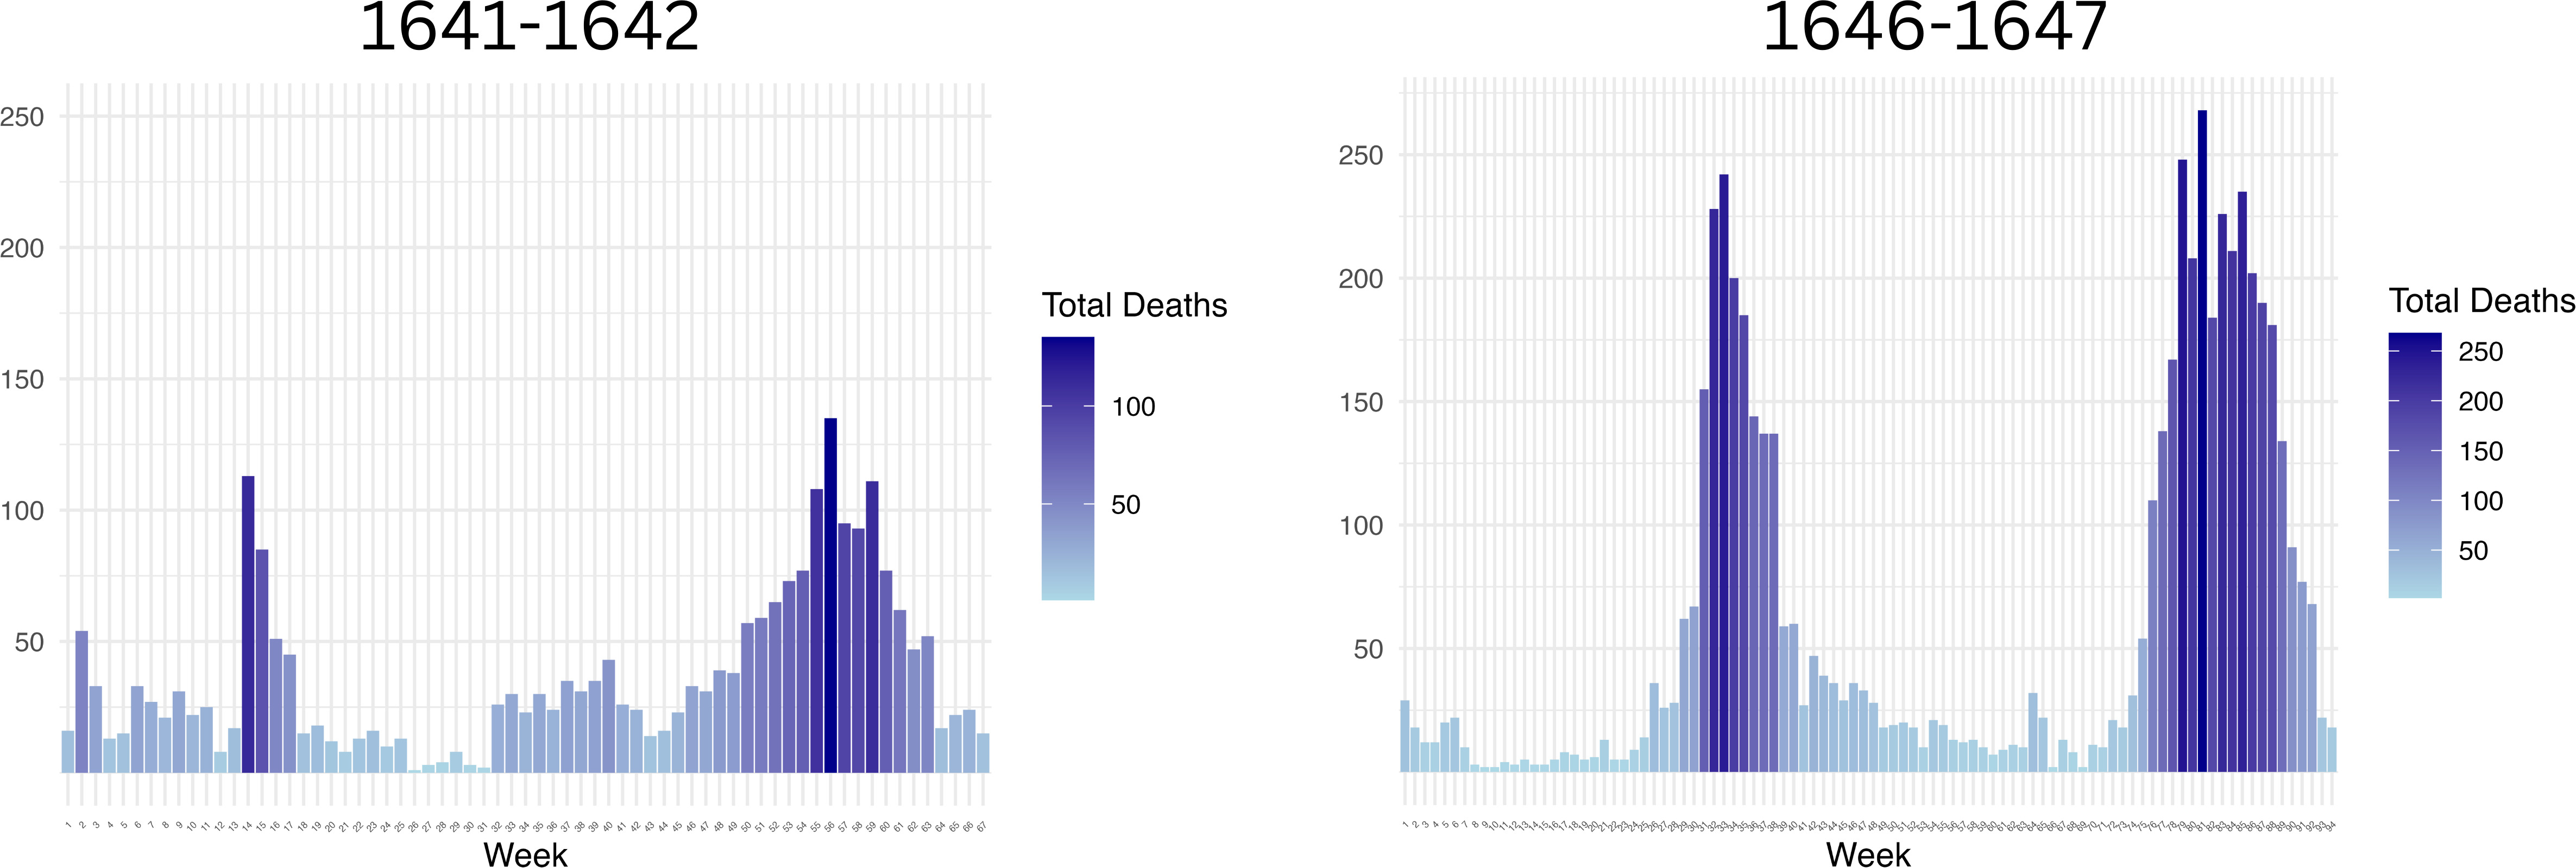
Figure 9. Biannual bar plots 1641-1642, and 1646-1647. The plots feature biannual bar plots for the periods 1641-1642 and 1646-1647. The plots demonstrate the continuous threat of the plague by showing that there was at least one plague casualty every week per year.
Finally the parishes in group 1 (within the walls of London) behaved in a similar fashion during the 1640s. In each of the years analyzed, the absolute number of parishes that experienced at least one death is considerably higher than during 1638 and 1639, and increases in 1646 and 1647. These findings suggest that while group 1 fared better than the rest of the groups of parishes, the conditions affecting survival were deteriorating. Groups 2 and 3, endured summers with more intense plague spikes compared to the walled parishes, potentially due to factors such as location, demographic characteristics, or insufficient public health measures. While group 1 benefited from better access to a secondary residency and effective enforcement of public interventions, the peripheral groups of parishes faced a disproportionate worse impact during the summer plague visitations.
Conclusion
This blog post analyzes seven out of the nine years between 1638 and 1647, applying time-to-event analysis as previously done for the 1636 outbreak. The findings reaffirm that the spatial trends from 1636 persisted, with the plague spreading more slowly within London’s walled parishes and more intensely in areas beyond, including Middlesex and Surrey. Despite year-round plague deaths in 1642, 1644, 1646, and 1647, severe outbreaks were notably absent within the walled parishes, though their overall situation worsened over the decade. The initial years of 1638 and 1639 saw a milder presence of the plague, which intensified in the 1640s with steeper declines in survival probability and increases in total deaths. The combination of quarantines, pesthouse isolation, and the sociodemographic traits of early modern London helped mitigate the outbreak effects through 1647. However, these measures were insufficient to eradicate the plague, which lingered until the 1650s.
Further historical research is essential to understand how public health measures implemented in 1636 influenced the period from 1638 to 1647, preventing the plague from escalating from a summer spike into a full-blown outbreak. Additional study is also necessary to explore why the plague escalated in the mid-1640s and to examine how spatial, socioeconomic, and demographic factors may have exacerbated the severity of the plague. Moreover, it is crucial to investigate whether the political instability and chaos of the Civil War impacted or aided the spread of the plague during this time. Lastly, more investigation is needed to determine the factors behind the near disappearance of the plague in the early 1650s.
These weeks correspond from September 8th, to October 20th. ↩︎
Weeks 39 to 44 correspond to early September to mid October. ↩︎
The project only had access to Bills from the years 1638, 1639, 1641, 1642, 1644, 1646 and 1647 and 1649. However, 1649 was excluded from the analysis due to the low incidence of the plague. ↩︎
These results reflect an intensification of the plague’s impact which can be explained due to changes in environmental factors, socio economic conditions, spatial and urban transformations, and also variations in the effectiveness and enforcement of public health interventions. ↩︎