| December 4, 2023
Death on Two Legs: Analyzing the initial 20 weeks of the 1636 London plague outbreak using time-to-event analysis
Death on Two Legs: Analyzing the initial 20 weeks of the 1636 London plague outbreak using time-to-event analysis. During the seventeenth century, England experienced multiple plague outbreaks. Although milder than the 1603 and 1624 plague crisis, London’s outbreak of 1636 claimed the lives of roughly 10,400 individuals, approximately 7.5% of the population in London and its liberties.1 In this blog post, I delve into the first stages of the 1636 outbreak, by scrutinizing the propagation of the plague through London’s city subdivisions, with the aid of time-to-event analysis. The results suggest that, although all parish groups encountered at least one case of the plague in the initial two weeks of the outbreak, the propagation of the plague in the parishes within the walls of London came to a relative halt. In contrast, the outbreak’s trajectory became significantly steeper in the remaining parts of the city, namely the parishes without the walls, the parishes in Middlesex and Surrey, and the outer parishes of Westminster. The analysis aligns with existing literature that highlights a prevalent spatial pattern for plague outbreaks in the seventeenth century: specifically, a milder impact within the city walls and harsher consequences in London’s peripheral areas.2 This spatial pattern can be attributed to a combination of factors, including stricter public health strategies–quarantines and isolation–implemented by the city government in the late sixteenth century, as well as the sociodemographic characteristics of early modern London. Furthermore, the analysis unveils that the implementation of containment measures led to a spatially differentiated trajectory of the outbreak: early plague deaths within the walls of London didn’t amount to a propagation of the plague with the same speed as the parts of the city outside the walls.
Time-to-event analysis
Time-to-event-analysis–also called survival analysis–enables the examination of the time it takes for the event of interest to occur. In this case, the event of interest is the occurrence of at least one plague death in each of the 131 parishes examined, during the first 20 weeks of the 1636 outbreak, which correspond to 1636 bills’ 20th to 45th weeks.3 The key tool in time-to-event-analysis is the Kaplan-Meier estimator, which calculates the survival function of time-to-event data. The survival function provides the likelihood of an event not occurring before a given time: applied to the 1636’s outbreak, the survival function measures the likelihood of parish groups not reporting a plague death–surviving the plague–up until the 20th week of the outbreak.4 This approach allows us to gain insights into key aspects of the outbreak, including the speed of infection, the order in which areas of the city were affected, the duration of the outbreak, and how factors like population density impacted the progression of the outbreak during this period.
By following the geographical partitions that appear in the London Bills of Mortality, the parishes have been divided into four groups: 97 parishes within the walls of London, 16 parishes without the walls, 9 out parishes in Middlesex and Surrey, and the 7 parishes in the City of Westminster and its Liberties. To compare the survival distributions of these groups of parishes, I used the Log-Rank test, a statistical hypothesis test that compares the survival distributions of two or more groups, to determine whether there is a statistically significant difference in the speed in which the plague propagated through these four groups of parishes. 5 The results suggest that, with a chi-squared statistic of 51 and a very low p-value, it is possible to argue that there are statistically significant differences in the timing of the first recorded plague death among the four categories (within the walls, without the walls, Middlesex/Surrey, and Westminster). The analysis indicates that there is something beyond random chance that is influencing the distribution of plague cases among the parishes during the specified time period.
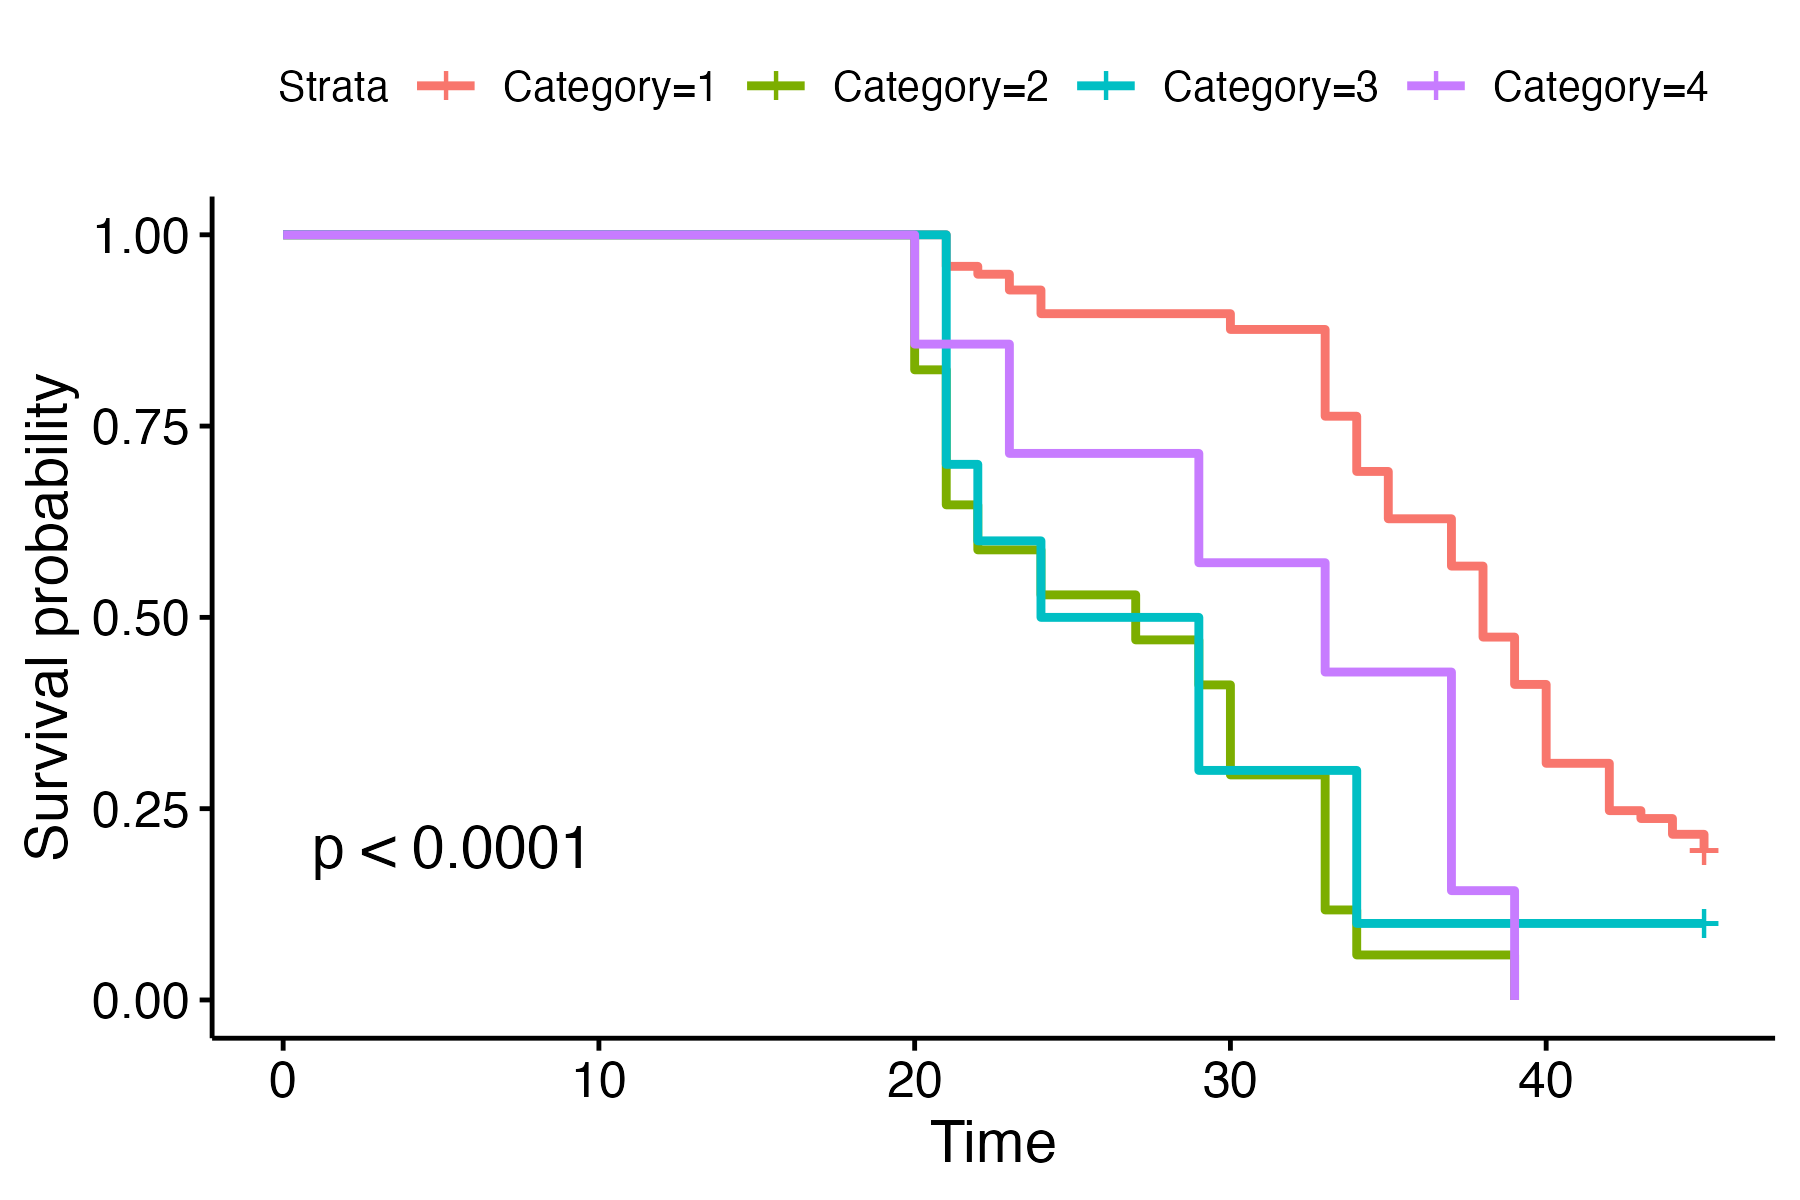
Figure 1. Survival distributions of the four groups of parishes. The plot shows the time-to-event distributions of the groups of parishes analyzed. The lines show the 97 parishes within the walls (red), the 16 parishes without the walls (green), nine out parishes in Middlesex and Surrey (blue), and the 7 parishes in the City of Westminster and its Liberties (purple). Note how the parishes within the walls only reported a significant number of cases after 1636’s 33th week, which corresponds to the 9th week of the outbreak.
Death on Two Legs: a spatial representation of time-to-event analysis
As mentioned before, performing a time-to-event-analysis of the initial 20 weeks of the 1636 outbreak highlights a distinct timeline and propagation velocity for the walled portion of London, compared to the rest of the city. The existence of two varying distributions is what I call death on two legs6, that is, two spatially determined timelines for the spread of the plague. This twofold structure of the propagation has been conceptualized in the specialized literature as a distinctive pattern of the plague outbreaks in the 17th century: milder within the walls, harsher in the periphery.
This pattern, however, does not imply that the walled parishes did not experience plague deaths during the initial weeks of the outbreak. Data collected from the London Bills of Mortality shows that during the 1636 bills’ 20th week–ranging from April 28th to May 5th–four plague deaths were reported in the group of parishes immediately outside the walls, whereas 6 plague fatalities were found in the parishes in the City of Westminster and its Liberties, corresponding to the outer part of the city.7 As early as the second week of the outbreak (that is, the 1636 bills’ 21st week), 5 parishes out of 97 that composed the parishes within the walls of London reported one plague death, namely, St. Andrew Undershaft, St. Dionis Backchurch, St. Dionis Backchurch, St. Margaret Newfishstreet, and St. Peter Cornhill. Nevertheless, the plague did not spread to other parishes of the walled city between week 25th and week 33th, and new deaths were solely reported in locations that had experienced a prior plague burial within the initial 5 weeks. By the 33rd week, though, 18 parishes documented their initial deaths. From weeks 34 to the final week, an average of 6 parishes reported their first plague-related death every week. This pattern and velocity of spread stands in contrast to the other groups of parishes–the 16 parishes without the walls, the 9 out parishes in Middlesex and Surrey, and the 7 parishes in the City and Liberties–in which most parishes experienced at least one plague death before the 33rd week.

Figure 2. Spatial representation of the duration of the plague. The map shows a spatial representation of the time-to-event-analysis. The parishes in dark blue experienced the plague between weeks 20-25. The clearer the color, the later a parish experienced at least one plague case. The image reveals a distinct pattern: a minority of inner-wall parishes had at least one plague case in the initial 5 weeks, while most outer-wall parishes—encompassing the 16 without walls and the 9 in Middlesex and Surrey—reported at least one case during the same period.
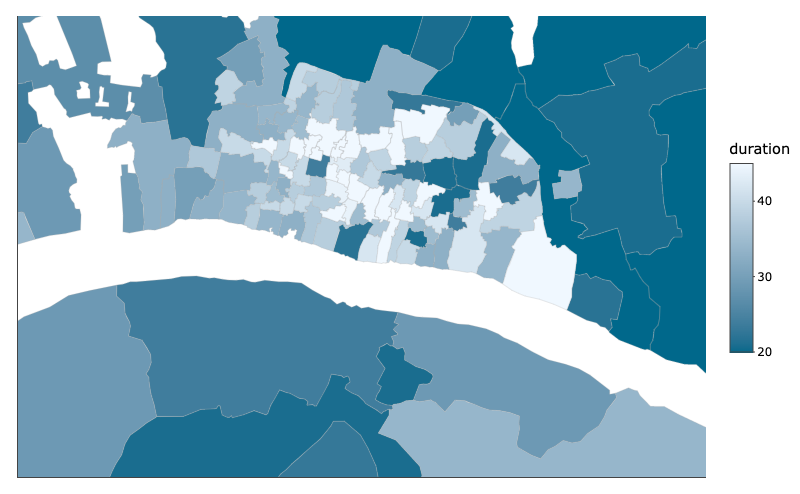
Figure 3. Close up image of the 97 parishes within the walls; While parishes within London’s walls did report plague-related deaths in the early stages of the outbreak, these cases did not contribute to the rapid spread of the plague, as observed in the areas outside the city walls. Still, the analysis reveals spatial variations in implementing containment measures. Specifically, even though parishes within London’s walls recorded plague-related deaths during the initial phases of the outbreak, the pace of plague transmission in these areas differed from that observed in the regions beyond the city walls. This discrepancy is partly attributed to affluent residents within the walls fleeing the city in the initial weeks, curbing the rapid plague spread.
What factors explained this pattern of spread of the plague? First, socioeconomic conditions and residential differentiation. As Roger Finlay explains in Population and Metropolis: The Demography of London 1580-1650, understanding the structure of London society becomes significantly enriched by exploring residential differentiation, revealing important differences in both fertility and mortality among parishes in affluent and impoverished areas. According to Finlay, although “wealthier Londoners tended to live in the centre of the city whilst the poor were more likely to occupy the peripheral areas around the walls and along the riverside (…) [t]he residence of the majority of Londoners of intermediate means was less well defined.”8 Moreover, residential differentiation moved not only along the lines of parishes, but also at the intraparish level. As Finlay suggests for the case of Bristol, “plague deaths were few in the main street but were clustered in the back alleys of the parish.”9 However, despite evidence suggesting that the plague was most severe in the poorest parishes–due mostly to overcrowding and poor hygiene–there is limited correlation identified between the density of housing and the magnitude of the crises. In sum, the most relevant factor that explains the relative halt and slowed speed of the spread of the plague in the walled parishes between weeks 25 and 33 must have been that “[w]ealthier people tended to leave their homes during the crises, and thus plague was socially selective even within individual parishes.”10
Secondly, in the late sixteenth century, the city of London started to implement public health measures to restrain the plagues, like quarantines and home isolation of the sick. Those initiatives did not become widespread in England until the late 1500s. In 1564, William Cecil, the head of the privy council, utilized the printing press to enforce that infected houses should be quarantined for forty days, and sick individuals should remain indoors. These Public Health measures became encapsulated in the Plague Orders from 1578 to 1625.11 Firstly, the implementation of a taxation system during epidemics, and secondly, the enforcement of stricter isolation for the sick, which included the confinement of entire families in infected houses. While the initial pesthouse was constructed in 1564, a significant policy shift occurred by 1630 under Charles I, who “recommended the isolation of the sick in pesthouses or hospitals” as better than “their incarceration in their own homes.”12 Following the devastating Great Plague of 1666, the New Rules and Orders witnessed a notable increase in investment in pesthouses, as an alternative to isolation of the sick in their homes.
Public health stirred significant controversy among London’s population. From an urban perspective, the growth of London brought large populations beyond the control of the city of London. In the Liberties, Westminster, and Middlesex, the City of London could only consult the authorities, but it was unable to exert direct command. 13 In the early stages of the implementation of these policies, the stretching of London brought problems of authority, derived from the lack of a sovereign board of health. Moreover, household segregation was deemed impartial, inefficient, expensive, and hard to enforce. For people with no second residences, house “quarantine[s] commingled the sick and the well”, and was blamed for increasing the death toll. As Kira Newman suggests, the popular view “portrayed quarantine and isolation as personal punishment rather than prudent policy.” 14
Conclusion
Analyzing the initial twenty weeks of the 1636’s plague outbreak with the aid of time-to-event-analysis yields several insights. First, the analysis corroborates a spatial pattern observed in seventeenth-century plague outbreaks: milder within the London walls, and harsher in the peripheral areas. However, that pattern is not a result of the absolute absence of the plague in walled areas, within the earlier weeks of the plague. To the contrary, both walled parishes and the parishes in the outer parts of London experienced plague deaths in the initial five weeks. The results indicate that, although all parishes saw at least one plague case in the first weeks, the spread within the wall was limited. Conversely, the outbreak intensified in the remaining areas, including the parishes outside the walls, Middlesex/Surrey, and Westminster. The relative halt of the plague in the parishes within the walls after the fifth week of the outbreak can be attributed not only to socioeconomic conditions and residential differentiation, but also to the enforcement of plague containment measures by London’s authorities. The analysis reaffirms the differentiated application of public health measures, which may have led to varied trajectories for the plague in different sectors of Early Modern London. Further investigation is required to include other factors, such as residential differentiation and population density, into a comprehensive multivariate time-to-event analysis.
Works Cited
- Slack, Paul. The Impact of Plague in Tudor and Stuart England. London ; Routledge & K. Paul, 1985.
- Newman, Kira L. S. “Shutt Up: Bubonic Plague and Quarantine in Early Modern England.” Journal of social history 45, no. 3 (2012): 809–834.
- Finlay, Roger, Population and Metropolis: The Demography of London 1580-1650 (Cambridge: Cambridge University Press, 1981)
Kira L. S., Newman, “Shutt Up: Bubonic Plague and Quarantine in Early Modern England.” Journal of Social History 45.3 (2012): 809–834, 809. ↩︎
Paul Slack, The Impact of Plague in Tudor and Stuart England (London: Routledge & K. Paul, 1985), 159-161. ↩︎
The bills for weeks 25, 26, 28, 31, 32, and 36 are absent from the dataset. Consequently, my analysis is based on 20 weeks of available data, spanning from week 20 to week 45 of 1636. ↩︎
While there is some right-censored data (deceased individuals who didn’t experience the event within the chosen timeframe), it only comprises 15% of the dataset. ↩︎
Log Rank test is a non-parametric test, which means that it does not assume any specific probability distribution for the survival curves. In this case, the null hypothesis claims that there is no difference in survival between the four groups. The alternative hypothesis, that is –the one that we want to probe by performing the test– is that there is a significant difference in the survival distributions, which translates into a difference in the patterns of spread of the plague among parishes. ↩︎
Death On Two Legs (dedicated to…) is a song by the British rock band Queen, and it is the opening track of their fourth album, A Night at the Opera. ↩︎
The data breakdown is as follows: Among the 16 parishes outside the walls, St Botolph Aldgate documented 2 deaths, St Botolph Bishopsgate reported 1 fatality, and St Giles Cripplegate also reported 1 death. Within the 7 parishes in both the City of Westminster and its Liberties, St Dunstan Stepney documented 6 fatalities due to the plague. ↩︎
Roger Finlay, Population and Metropolis: The Demography of London 1580-1650 (Cambridge: Cambridge University Press, 1981), 71. ↩︎
Finlay, Population and Metropolis…, 122. ↩︎
Finlay, Population and Metropolis…, 122. ↩︎
Slack, The Impact of Plague…, 209. ↩︎
Slack, The Impact of Plague…, 210. ↩︎
Slack, The Impact of Plague…, 211. ↩︎
Newman, “Shutt Up”…, 810. ↩︎