| April 10, 2023
What happens when 'Is Missing' becomes more literal?
As Death by Numbers has evolved and developed, there have been some slight changes to our workflow, which caused us to reconsider how to work through and present our data. One of those shifts came about because we set up our workflows using early 18th century bills as a model, before shifting to work with the bills from the mid and late 17th century.
As a team, we quickly realized that the older bills were falling apart and had more missing information than the bills produced later. This caused some issues in our workflow, however, because previously we were using Datascribe’s ‘is missing’ marker for parishes who did not report any death information from that week. This was because the longer the bills were printed, the less reliable they became, especially by the 1700s. When we started, we felt our original method was a reasonable way to denote possible unreported deaths. However, when looking at bills that were literally missing sections due to degradation, we had to reevaluate how to use that flag. This new use was much simpler: only using ‘is missing’ flags when parishes were literally missing from the bills (usually because they didn’t exist yet), and use a combination of the ‘is missing’ and ‘is illegible’ flags for the parts of the page that are nonexistent and affect the readability of the data.
It became clear that there were two ways to move forward with the project. The first option was to go into each 18th century record we had already transcribed, and remove the ‘is missing’ flag from all parishes with no death reports, which the team promptly rejected as having too high of a time cost with too small of a benefit. The second option was to break up the partially transcribed datasets in Datascribe—creating separate datasets for the old and new transcription methods—and then keep moving forward with the new rules for ‘is missing’ and fix the old records later, programmatically. We opted for option two. Not only did the second option make the transcription team happier, but also it made sense from a project management standpoint. Transcribers could still make headway transcribing new bills while a script to transform the data exports from previously-transcribed bills was still being worked out.
This did affect our workflow a bit between the older and new transcribers. The transcribers on the project from the early days had to adjust to a new workflow with much less button clicking (which they were more than happy about), but it took some time to break the old habits. There was an effort to not click all the buttons, but there was also a visual component of having to double check that we were entering the data in the correct boxes. The way the dataset is organized in Datascribe, there is an entry box for the parish’s reported weekly deaths and that same parish’s report of plague for the week, as seen below. This meant that older transcribers could no longer use the “is missing” flag to keep track of where they were in the list, and needed to find new ways to transcribe the information accurately.
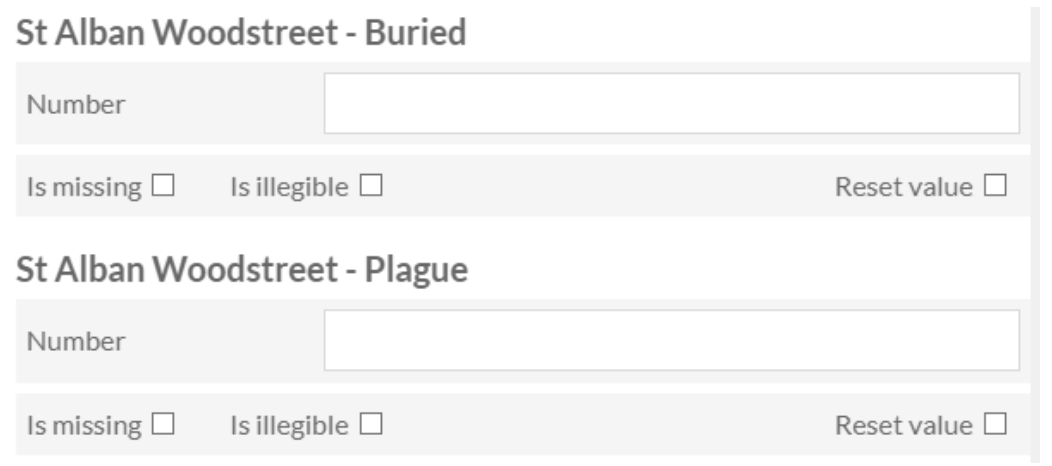
Figure 1. Figure text include here.
As a relatively new transcriber on the team, I (Cecilia) still had some issues losing my place in the bills. In the set I was originally trained on—the 18th century Laxton bills—many categories were left empty most of the time, so I could easily see my place by looking for where I last marked “is missing.” This was especially helpful, since the Laxton transcription form does not display the form fields in the same order as the bills do, since that order changed over time. We had to jump across the page multiple times to fill in the numbers for St. Vedast (alias Foster) in the Datascribe field for St. Foster, or skip the St Maudlin entries before they come back up later in the entry form as St Mary Magdalene. This method was also incredibly slow. I was able to get one bill done in about fifteen minutes on a good day, but it sometimes took longer if the bill had some strange illegible numbers.
Soon after I started on Death by Numbers, our Principal Investigator Dr. Jessica Otis left for England and came back with a shiny new (nearly five-hundred year old) Bodleian dataset which had plague deaths, so naturally that became our new priority. The problem was, as previously mentioned, the Bodleian set was physically missing a lot of information due to tearing, staining, and disintegration. At this point, “is missing” did not just represent parishes not getting their counts in on time. This flag, combined with the “is illegible” flag, became a statement on the condition of the document, which we otherwise have no way to display to a future user of the dataset.
Luckily, by swapping to only marking “is missing” for damaged documents, we were better able to use the “quick entry” mode on our Datascribe, which hides the boxes to mark “is missing” or “is illegible.” This allows us to easily tab through the entry boxes instead of manually clicking on each box we wanted to add to, increasing how quickly we could enter data.
For my work, I would specifically use “ctrl-f” to find and mark these sections before starting, and then I would “ctrl-f” the word “buried”, which would highlight all the sections to enter data for burials. Our use of “ctrl-f” or the iOS alternative of “command-f” was particularly helpful when the entry for buried and plague counts seemed to blend together. Due to these new methods, I was able to about double my speed for transcribing bills and it seems to have had a similar impact on the efficiency of my colleagues’ work as well.
While data entry seems like a cut-and-dry activity, there is a lot of subjectivity to how it can be done. Our evolving use of the “is missing” flags is just one example of how this subjectivity can both reflect interesting things about the document, but also improve our transcribers’ work flow so that we can transition to data analysis sooner.