| November 21, 2022
Building a Data API for Historical Research
We are in the process of building out a data API to support the data work we’re undertaking with the transcription of the plague bills. We anticipate hundreds of thousands of rows of data by the end of our transcription process, and we wanted an easy and efficient way to work with that data.
As part of our work in data-driven historical research at RRCHNM, we are building a data API to store and access data from databases. Following the process of transforming the DataScribe transcriptions into tidy data, the resulting data is uploaded to a PostgreSQL database where we can take advantage of relational connections among the different datasets we’ve compiled.
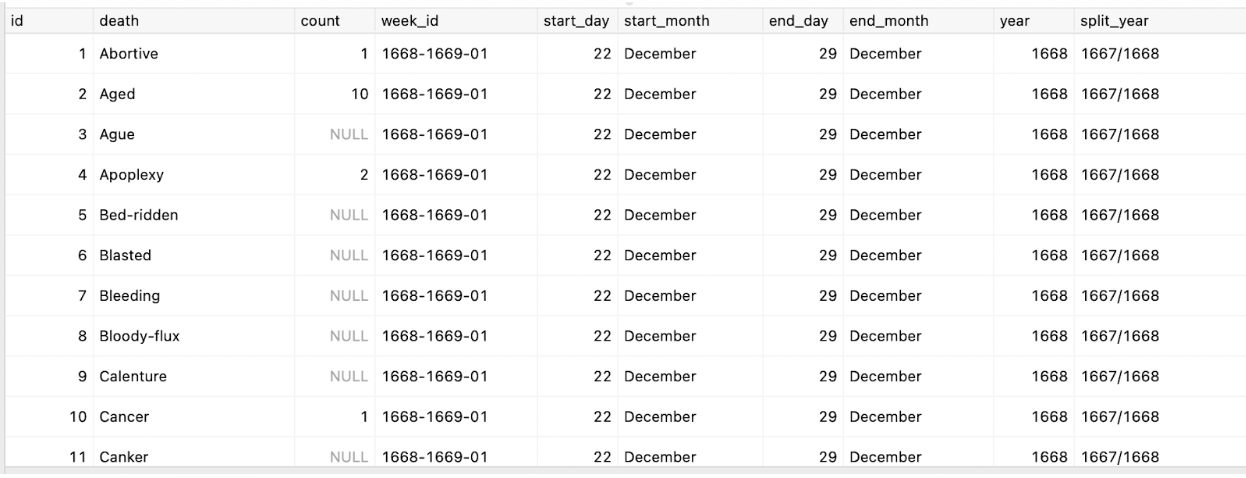
Figure 1. A screenshot of a database query showing the cause of death, count, week, and year records.
The advantage of having our data structured this way is we can keep our data consistent (PostgreSQL enforces strongly-typed data) and we can more easily combine data into different configurations based on what we’d like to display or visualize. We can keep the list of parishes separate from how we count burials or deaths data, or the weeks consistently applied across the entire dataset, without having to worry that there’s a mistake in the data or the transcription. And if we do spot an error, there’s one place to go to fix it.
An API also gives us the advantage of speed: the queries we send to the data table are fast and flexible, allowing us to really take advantage of the relational connections among datasets. While we provide the flat data files as downloads for others to work with, it’s much harder to do the kind of web-based querying and recombining we’d like to achieve with flat data files.
We currently provided four key endpoints (the location where an API receives requests from software for data) for our data. The largest is the bills/ endpoint that returns all of the weekly and general bills data and the number of people buried or having the plague in an individual parish. These rows are linked together with parishes, years, and weeks that allow us to return the entire dataset or specific queries over time and space.
[
    {
        "name":"All Hallows Barking",
        "bill_type":"Weekly",
        "count_type":"Plague",
        "count":null,
        "start_day":21,
        "start_month":"December",
        "end_day":28,
        "end_month":"December",
        "year":1669,
        "split_year":"1668/1669",
        "week_no":1,
        "week_id":"1669-1670-01"
    },
    {
        "name":"All Hallows Barking",
        "bill_type":"Weekly",
        "count_type":"Buried",
        "count":2,
        "start_day":21,
        "start_month":"December",
        "end_day":28,
        "end_month":"December",
        "year":1669,
        "split_year":"1668/1669",
        "week_no":1,
        "week_id":"1669-1670-01"
    },
    ...
]
We also provided an endpoint labeled causes/ that returns a particular cause of death and the amount for a given year, week, annual report, or parish.
[
    {
        "death_id":1,
        "death":"Abortive",
        "count":1,
        "week_id":"1668-1669-01",
        "week_no":1,
        "start_day":22,
        "start_month":"December",
        "end_day":29,
        "end_month":"December",
        "year":1668,
        "split_year":"1667/1668"
    },
    {
        "death_id":2,
        "death":"Aged",
        "count":10,
        "week_id":"1668-1669-01",
        "week_no":1,
        "start_day":22,
        "start_month":"December",
        "end_day":29,
        "end_month":"December",
        "year":1668,
        "split_year":"1667/1668"
    },
    ...
]
An additional endpoint provides data on christenings as recorded in the plague bills (`christenings/ endpoint), as well as a few endpoints that only exist as ways for us to feed into our project (and, thus, aren’t likely much use for others wanting to do analysis).
This computational infrastructure feeds into the web components that we are building for the project. The first of these is an interactive and filterable table of the data that displays the returns from the bills/ endpoint – that is, the entirety of the dataset, count values, parishes, and chronology. We keep all of this very fast through limit and offset queries so that, in the browser, data is loaded and filtered instantly as the interface is changed.
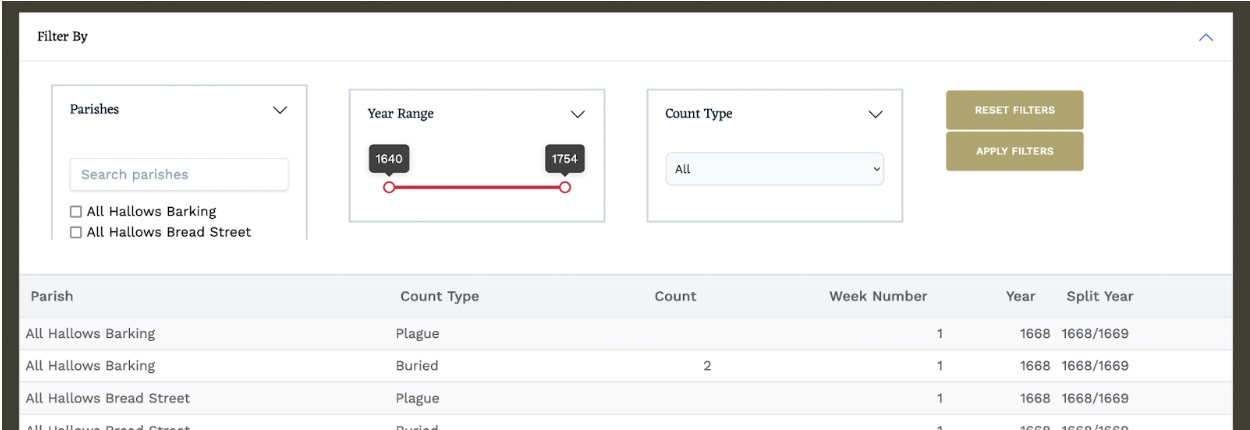
Figure 2. A screenshot of the graphical user interface for filtering and viewing the bills data. The filter includes ways to select specific parishes, year ranges, and count types (the number buried or the number with plague).
We also use the endpoints to power the visualizations, which themselves will be reactive to filters applied by users. These are still in an early phase of design, but just like our tables we can fetch the data we want to visualize in charts, networks, and maps.
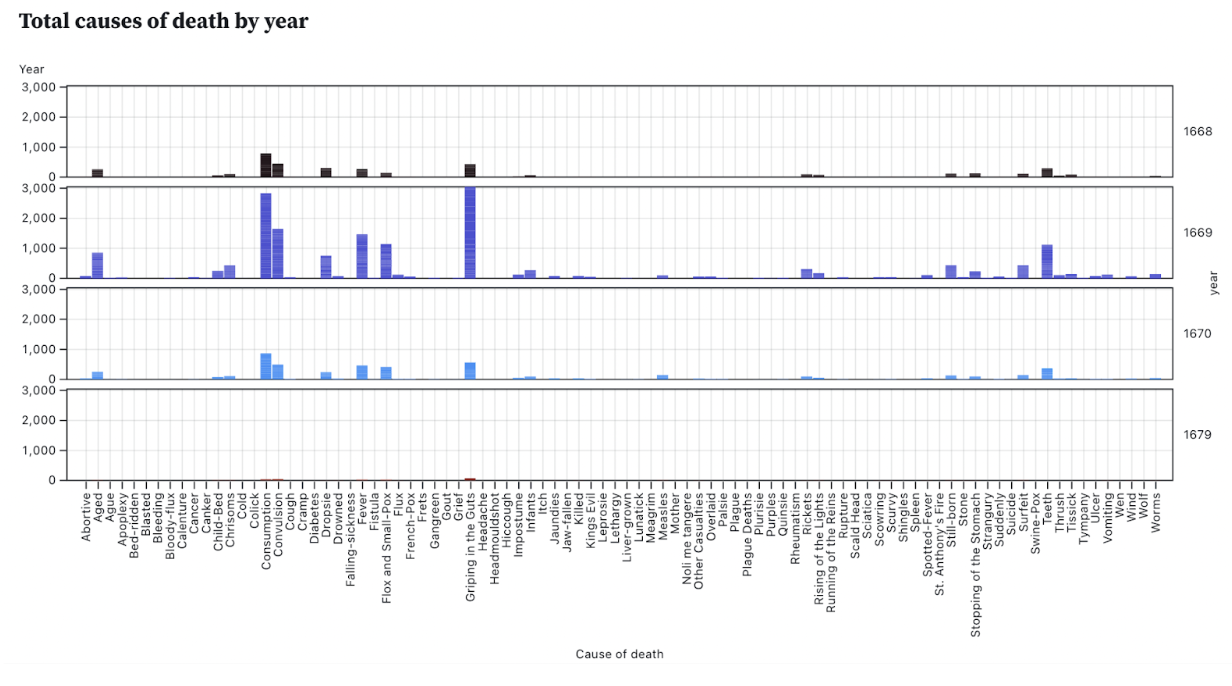
Figure 3. A sample data visualization, a small multiple bar chart showing the amount of causes of death for 1668, 1669, 1670, and 1679.
The additional value here is, while the API is fairly purpose-built for the web application, it can be used in other programming environments like R or Python, or interactive notebooks like Observable and Jupyter. This means researchers can explore specific points of data among individual parishes or specific causes of death reported in the plague bills all through a simple API query. The queries are consistent across each of the endpoints, typically accepting start-year, end-year, bill-type and count-type parameters. A more detailed look at the API’s specific parameters can be read in the documentation. This means, for example, you can use the API in an Observable notebook like this one that lets you explore and visualize the data outside our web application and recombine or visualize that data in new ways. As our dataset continues to grow, having access to that information from a fast and queryable database allows us a great degree of flexibility, data assurances, and opens up new ways for us to recombine data in creative ways.