| July 18, 2022
Old Age and Aged Deaths
The London Bills of Mortality were originally and primarily focused on deaths from plague, however they very quickly expanded to include other causes of death as well. From accidents and drownings to measles and smallpox, the printed bills included citywide summary statistics—rather than parish-by-parish breakdowns—for each week.
While we can therefore learn a fair amount about causes of death throughout the city, very little information can be gleaned from the sixteenth- and seventeenth-century bills about the age at which people died. True, chrisoms indicated a baby less than a month old, while infants indicated a slightly older baby, but what about deaths from teeth or choking? Was a person dying in childbirth a preteen or a woman in her forties? Diseases like consumption (tuberculosis) spared no one, young or old, and probably killed two Tudor kings: Edward VI, aged fifteen, and his grandfather Henry VII, aged fifty-two. Even deaths flagged as “Aged” don’t give a clear sense of how old, exactly, one had to be to die of age in the early modern period.
In December 1727, however, the Bills of Mortality underwent a significant formatting change. From the first London bill of the 1727/8 year onward, the bills break down the total number of deaths by age range: children under two, between two and five, between five and ten, and by decades thereafter, ending with a “ninety and upwards” category that still had a couple of deaths each week. For the first time, the bills explicitly and quantitatively showed what contemporaries already knew to be true: children who survived the staggering mortality rate of infancy and early childhood could, in fact, hope to live another half century or even more.
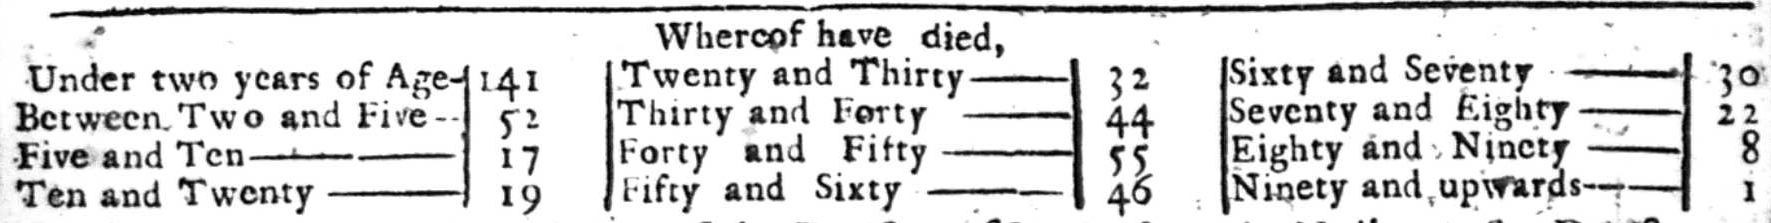
Figure 1. London 1 1727, verso
By December 1729, it became apparent that enough people were dying in the 90+ age cohort—and that there was enough interest in the long-lived to be worth the ink—to add additional information on centenarian deaths. In addition to the (newly renamed) Ninety & a Hundred category, the bill began to list the age of each centenarian at death. In the first of the newly reformatted bills, three people died aged 90+. While we can’t tell from the bills how old one of those three people was, we know that the others were 102 and 104 respectively.
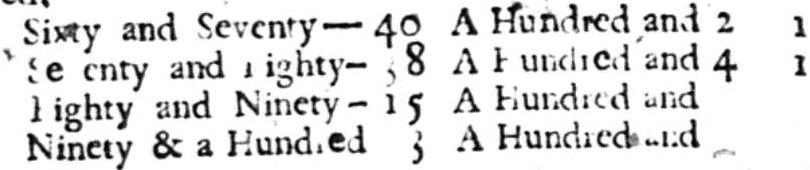
Figure 2. London 3 1729, verso
The age counts help clarify, but also complicate, our attempt to understand “Aged” as a cause of death. First and foremost, they make clear that “Aged” does not necessarily correlate with what we in the twenty-first century would call old age. In the bill from December 1727, pictured first above, there were 61 deaths attributed to “Aged” and 61 deaths in the 60+ age groups. Was everyone who died over the age of 60 counted as an “Aged” death? A quick glance at the subsequent week shows 74 “Aged” deaths with 93 deaths in the 60+ age groups, quickly disproving that theory. Indeed, the discrepancy between these two numbers sometimes reaches 1:2 over the subsequent years and decades. While it seems plausible that one had to be at least in one’s 60s before dying as “Aged”—and that most deaths among septuagenarians, octogenarians, nonagenarians, and centenarians fell into this category—not all deaths in the 60+ age groups were categorized as such.
| Year | Aged | 70+ | Centenarians |
|---|---|---|---|
| 1740/1 | 2517 | 2458 | 14 |
| 1741/2 | 2132 | 1928 | 9 |
| 1742/3 | 2369 | 2206 | 14 |
| 1743/4 | 1566 | 1367 | 3 |
| 1744/5 | 1813 | 1575 | 11 |
| 1745/6 | 2354 | 1950 | 10 |
While we are still transcribing the eighteenth-century bills, a quick look at the bills from 1740/1-1745/6 shows that the annual number of “Aged” deaths is always close to but slightly higher than the sum of deaths in the 70+ cohort. As a person approached and then surpassed the biblically-predicted human lifespan of threescore and ten, it seems probable that most deaths were recorded as “Aged” unless there was a clear reason to give an alternative cause (e.g. accidental deaths).
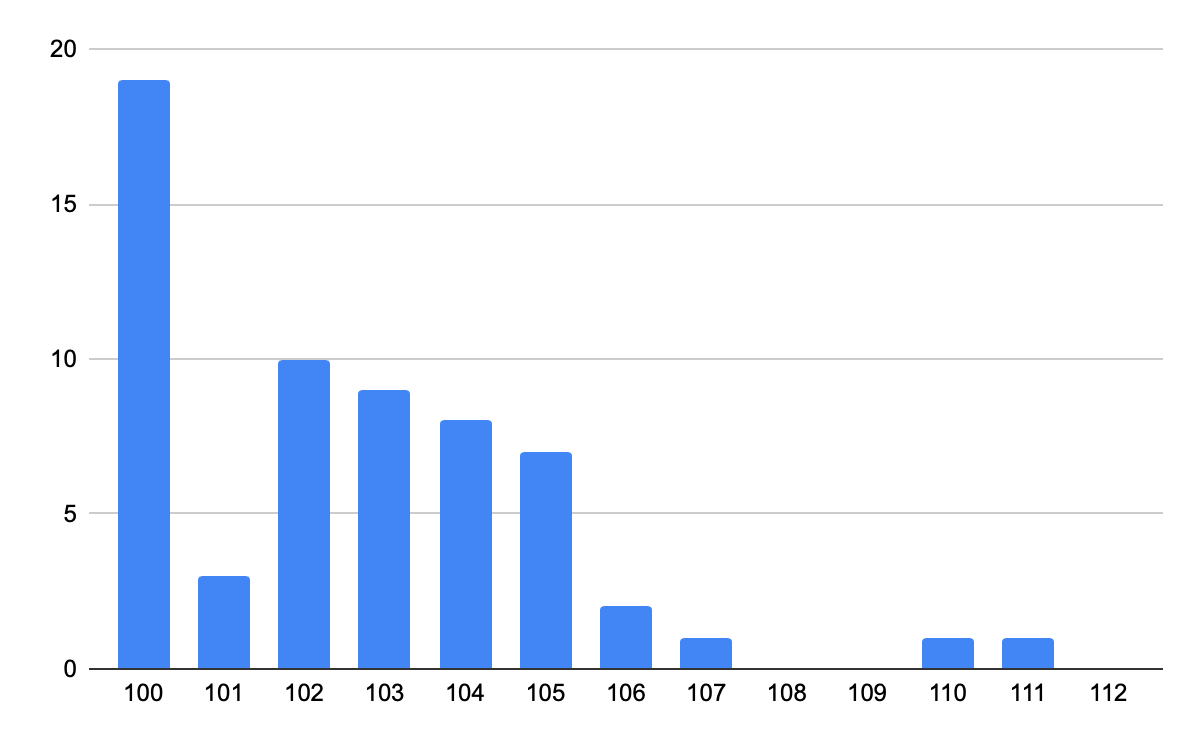
Figure 3. Number of deaths per old age.
The number of centenarians varies from year to year, but only in the relatively low mortality year of 1743/4 does it dip significantly below the low double digits. Nearly a third of these deaths are at the nice round number of 100—likely including a half dozen or so deaths that were actually at age 101 given the low number of deaths at that age—but a significant number also die at the age of 102 (10), 103 (9), 104 (8), and 105 (7). Two centenarians even held out for another decade to die at age 110 in January of 1741/2 and 111 in December of 1744/5 respectively. Even by twenty-first century standards, those are truly deaths by old age. As we continue to transcribe the bills, we are curious to see if these patterns remain or if they show any discernible shift in eighteenth century ideas of how old the “Aged” really were.