| April 25, 2022
From Archival Sources to Computational Analysis, Part One
Have you ever wondered how a complex project like Death by Numbers comes together? This post is the first in a series about the workflow that takes us from archival sources to transcriptions formatted for computational analysis. Let’s begin with digitization.
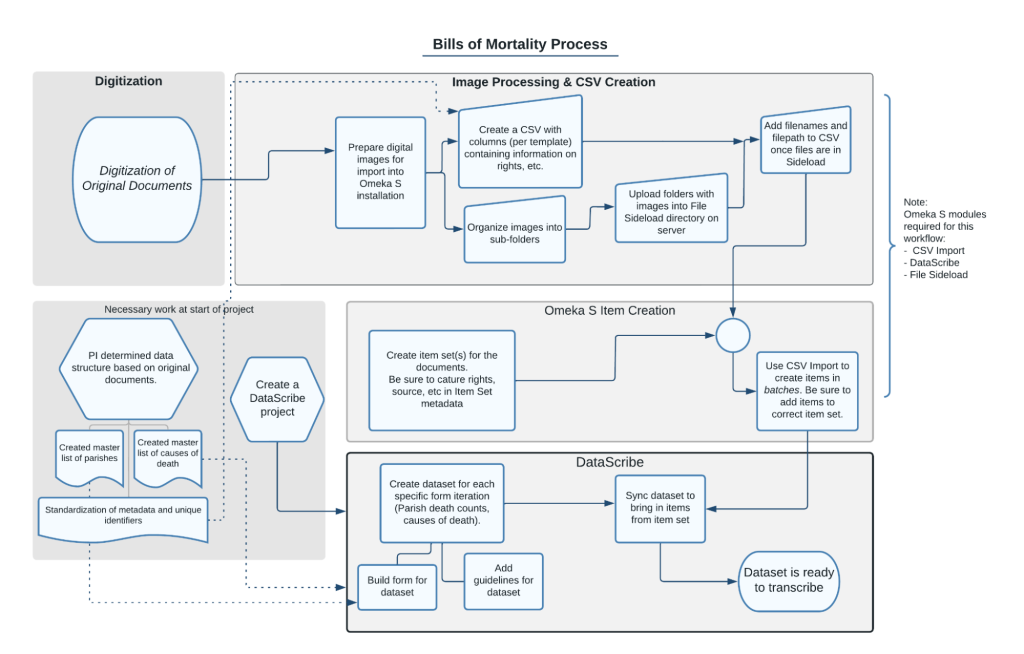
Figure 1. diagram of image preparation workflow showing process from digitization to image processing and CSV creation to omeka s item creation to datascribe transcription.
Digitization of Original Documents
There are many ways historic documents become digital objects, and the BoM project is built on documents from a variety of sources. Sometimes we are working with digital images created by commercial publishers from microform reproductions of originals, but in the case of a set of bills in the care of the Wellcome Collection, the project director handled the primary sources directly and took the digital photographs.
These bills, which were originally collected by the Medical Society of London, have been bound into volumes. While binding undoubtedly helped preserve the bills, they were not designed to be read in this way. The binding introduces some challenges for readers, photographers, and transcribers, most notably by hiding a sometimes significant amount of information “in the gutter.” (In book speak, the gutter is the inner margin where facing pages meet when a book is open.)
Preparing Digital Images for Import into Omeka S
The heavy lifting of transforming thousands of original photos into working documents for the BoM project happens in a tool called Tropy. We start with a custom metadata template that allows us to enter information about all images in a given batch consistently and efficiently with a bulk edit function. Metadata needs will vary from project to project. For BoM, some of the standard elements include name of the source archive, the rights information, identifier, and contributor. Using a custom template for the project ensures that we will have accurate data for the import into Omeka S. Because most of these bills will not be displayed on the public site, the primary function of this metadata is administrative rather than descriptive, designed to make it possible to backtrack to a specific document if there is ever a question about the transcription.
Next up is rotation of the digital photos so that they are all oriented the same way. Now we are in a position to assemble the bills from the big batch of images, pairing the recto and verso for each week, a step which sometimes requires the help of a “gutter shot” that shows information buried deep in the binding. Much of image preparation involves looking at the form of the bills rather than the content, but occasionally you have to get up-close and personal with the causes of death to accurately match images. Zooming in on the details in the gutter shots (griping in the guts at the top of the list, stopping of the stomach is about halfway down, and tissick and winde line up with the worm hole in between columns) allows you to confirm the relationship of images when you zoom out and see the whole sheet. As the bills are sorted, we add the metadata elements that are unique, such as the week number and year.
Some of the challenges in this part of the process include:
- bills appearing out of chronological order in a given volume
- bills bound into the volumes backwards (verso before recto/back before front)
- obscured or distorted text, which can be the result of a number of things - tight binding, stamps of ownership, the cord used to hold the book open, curvature of the page (a by-product of number of bills bound into a volume), and the occasional wormhole (literally, holes created by bookworms munching on paper!).
A few of these difficulties carry over to the transcription process as well.
While the thrill of interacting with the bills in printed form might have worn off for the project director (after going through seven volumes covering 35 years, shooting each bill, one side at a time), from the point of view of a person processing images, knowing that you can ask “what happened here?” when you hit a snag and get an answer from the person who took the photos and kept good notes (e.g. working backwards in this volume) is priceless.
The final step of preparing the images in Tropy is exporting the metadata as a CSV file, the content of which is determined by the custom template. Each bill is a row in the spreadsheet, and the columns contain the specified descriptive data - type of bill, week number, year, source, rights, image filenames, etc. Stay tuned for a post about how we get from the CSV export to usable items in Omeka S.
-Megan S. Mitchell and Megan Brett