| January 31, 2022
The London Bills of Mortality
Plague epidemics were a recurring threat in late medieval and early modern Europe. While plague could and did strike anywhere, the most well-documented epidemics were often in cities. Responses varied across time and space, as city leaders and other political authorities attempted to avoid contagion, contain the sick, and understand the scope of the threat plague currently posed to their lives and their livelihoods. These responses included the creation of lists: lists of people sick with plague, lists of cities infected with plague, and–starting in the sixteenth century–lists of the number of people who had died of plague.
In England, the first plague policies were enacted in 1517-1518, after an outbreak of sweating sickness and plague that affected the royal court including the Lord Chancellor, Cardinal Wolsey. These policies included attempting to quantify the severity of various plague outbreaks in the city of London. While it is not clear what form the earliest reports took, by 1528 the London reports on plague deaths had already settled on a form that would appear throughout the rest of the early modern and into the modern era: lists of the number of deaths in each of the city’s parishes, lists of the number of plague deaths in the parishes, subtotals of plague and non-plague deaths, and lists of parishes “clear” of the plague. These London reports were originally circulated in manuscript form among the government of the city of London as well as the royal court. During the plague epidemics of 1592 and 1603, they were also printed in weekly broadsides for public consumption. London’s population rapidly embraced the bills as a quantitative tool for evaluating their risk of imminent death and consequently the bills were published weekly (soon accompanied by annual summaries) from 1603 until the early nineteenth century.
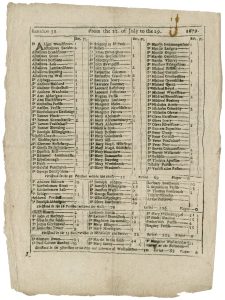
Figure 1. Front side of a broadside showing a week’s worth of deaths in the city of London, broken out by parish.
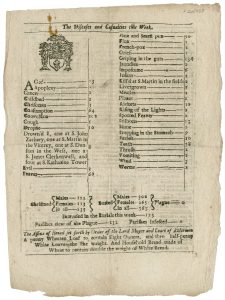
Figure 2. Back side of a weekly plague broadside from 1679, showing the various causes of death and the number of deaths per cause, citywide, as well as total christenings and burials by gender and the price of bread.
1679 Weekly Bill of Mortality. Call Number 265428. U__sed by permission of the Folger Shakespeare Library
The bills maintained a relatively consistent format over the centuries. As seen in the example above, the two sides of each bill offer a plethora of information. The front (recto) displays a list of city parishes in subsections based on London’s geography: parishes within the Walls, parishes without the Walls, out-parishes in Middlesex and Surrey, and Westminster. Two columns next to the list show the number of plague deaths and burials (all causes, including plague) within each parish for the dates listed at the top. At the end of each geographic subsection there is a total for each kind of death, as well as the total christenings. The terms “christenings” and “burials” are used deliberately here, rather than births and deaths; during the late seventeenth and eighteenth centuries, an increasing number of people were not christened or buried within the established church of England and thus were not always counted in the bills.
The reverse (verso) side lists “the diseases and casualties” or causes of death for London, which had more variable uniformity from week to week. Each week’s bills detail diseases, accidents, and even murders, ranging from childbirth and measles to “Rising of the Lights” and “Kill’d at S[t]. Martin in the fields.” Annual bills summarized specific deaths with catch-all terms like “Murdered,” and presented aggregate deaths of the year, such as 50 victims of measles and 71 people who succumbed to scurvy in 1682. This side also features the total christenings and burials by sex, the sum of plague deaths, the number of parishes infected and cleared of plague, and many years include the government-set weekly price of bread and other staple foodstuffs.
While most historical research is imagined as reading a diary in an archive or searching through old newspapers in a database, the London Bills of Mortality present quantitative and geographic data. In the week of July 22-29, 1679, there were two deaths in St. Mary Abchurch parish, nine deaths from “Stopping in the Stomach”, and 79 christenings in the 16 parishes without the walls. These example observations represent three points of the hundreds within each weekly bill. Amassed together or parsed by week, the bills offer possibilities to trace the spread of plague through London, contextualize sermons as parishes saw declining christenings, see changes in public health when consumption spikes, or reimagine the concerns of the average person when “Teeth” ranked as one of the most common causes of death.